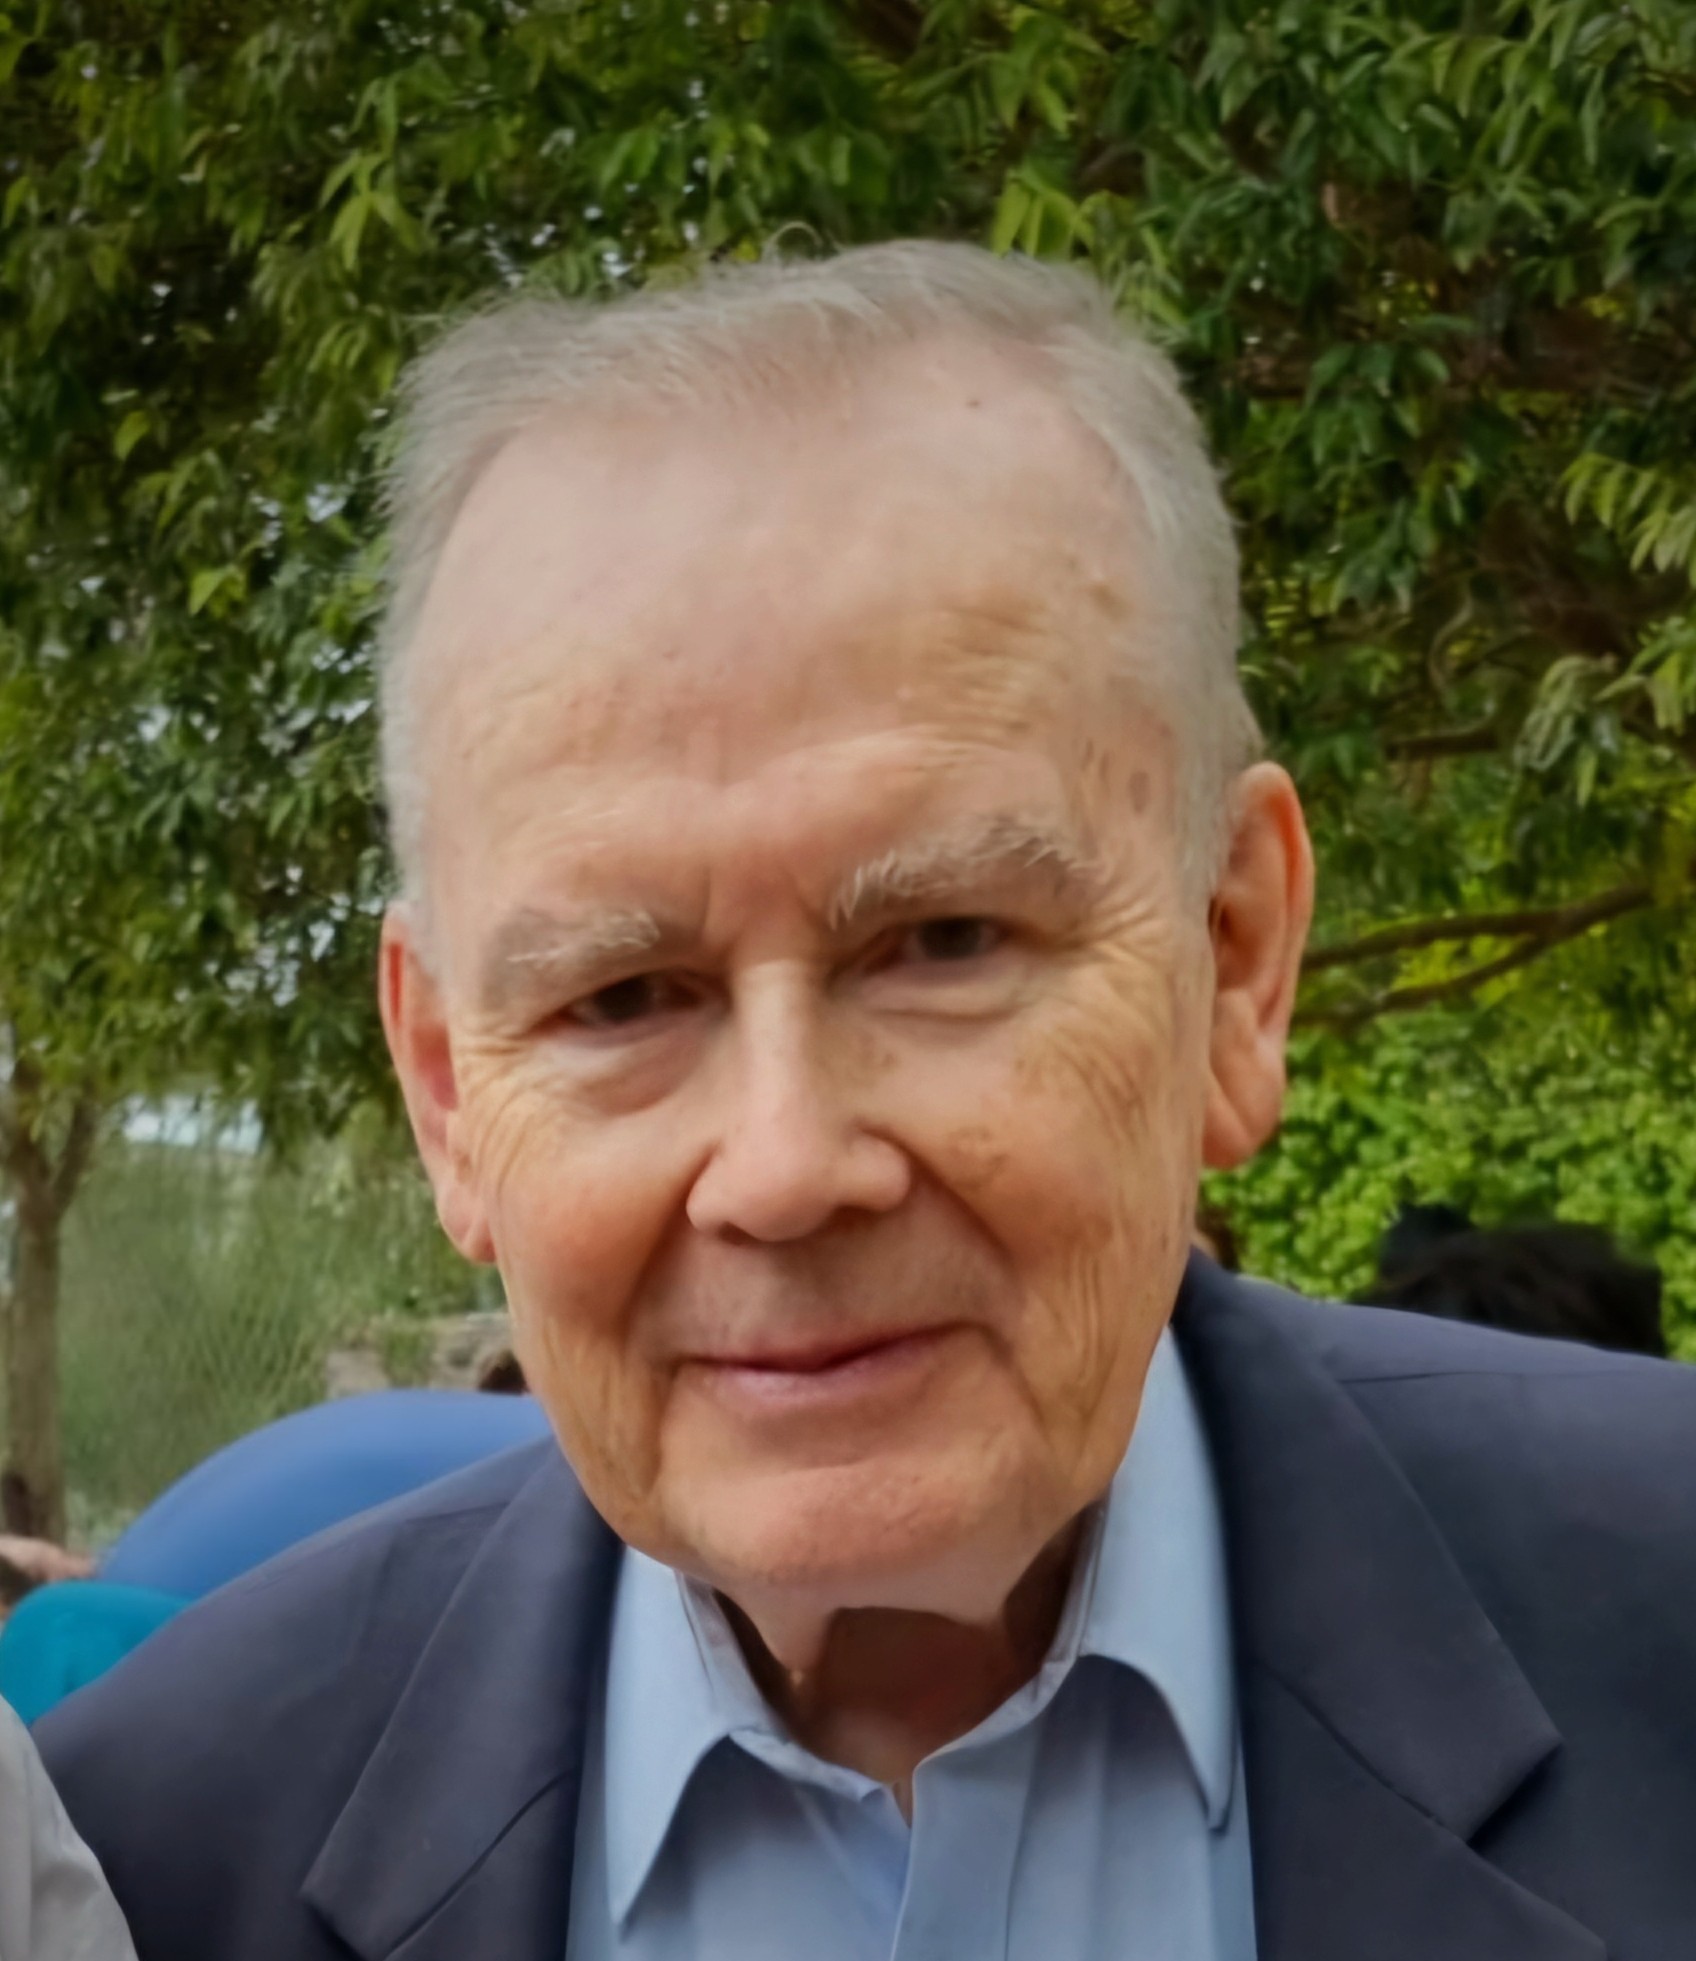
Phillip Cooney has recently passed the leadership of the NSW/ACT branch on to Max Williamson. As he steps back from the role, we invited Phil to share his thoughts on some of the changes he has seen.
“I have been asked to write a few words about the changes I have seen during my 57 years with PESA Ltd., PESA, and the original Professional Division of the APEA (only one P) the Australian Petroleum Explorers Association which I joined in 1969. During that time I have been lucky enough to have witnessed and to some extent participated in some of the most revolutionary changes in the Earth Sciences since James Hutton.
Firstly Continental Drift. It now seems incredible but when I first entered the Geology Dept. of the University of Sydney in 1962, the continents were considered fixed. Yes, there was Alan Day upstairs and his wandering magnetic poles with their changing polarities but nobody took him seriously. I remember vividly as a summer student at the then Bureau of Mineral Resources coming across in their library the book “The Origin of Continents and Oceans” a translation from the original German by Alfred Wegener. This was a revelation and I joined Alan Day as a convert to the idea of Continental drift, doing my Honours Thesis in 1965 on the paleomagnetism of some Tertiary Volcanics near Sydney which did indeed prove to have paleomagnetic poles located some distance from the present one. But again, what was the mechanism?
In 1969 I joined Esso Australia Ltd and discovered to my joy that Continental Drift was generally accepted and in 1971 at Esso Production Research Centre (EPRCO) Houston discovered why. EPRCO was like a very well equipped and financed university. There we had the opportunity to work with and even share an office with such authorities as Peter Vail, the father of eustatic sea level changes and their ability to enable global correlations on seismic data, and Bob Mitchum, one of the developers of seismic sequence interpretation and sequence analysis.
There we were told about the pioneering work of the Scripps and Lamont Doherty Oceanic Research Institutes and the positive and negative magnetic anomalies mapped by Frederick Vine and Drummond Matthews which ran parallel to the Mid Atlantic Ridge, their polarity sequence (“tiger stripes”) matching on both sides of the ridge and matching the sequence of those paleomagnetic poles already measured onshore. This showed that magma was being inserted at the mid ocean ridges (“sea floor spreading”) and magnetised as it moved away from the ridge. Proof that the ocean basins were growing!
I remember that while the spreading at the mid ocean ridges was generally accepted, crust destruction at the oceanic troughs/coastal ranges was not, the interpreted earthquake movements then available being inconclusive and this was interpreted by some authorities such as Prof. Sam Carey of Tasmania that the Earth could be expanding.
By the mid 70’s subduction zones had been mapped and apart from the geologists of the Soviet Union and a certain AAPG Journal editor, Continental Drift had moved from a theory to a working hypothesis. The miogeosynclines and eugeosynclines of my university days had become back-arc and fore-arc basins and numerous other originally puzzling phenomena (e.g. spilites) now had simple explanations. Simpler and more realistic stratigraphic and structural histories could now be made for a basin and different basins could be related and compared.
Secondly 3D Seismic. Different but almost as revolutionary was the change in seismic data processing and interpretation. When I joined Esso Australia seismic data onshore was still single or low fold and dynamite sourced. Off-shore data was still low (6 or 12) fold and also dynamite sourced though by the 70’s airguns had taken over, the reduced energy of the source being compensated for by much higher fold recording. I have already mentioned the improvements in seismic interpretation as a result of the work of Vail and Mitchum.
Data processing in the late 60’s was still relatively simple but swiftly becoming more sophisticated (complex). I still remember how defeated I felt during my secondment to the GSI processing centre, then at St Leonards Sydney, when told that the Fourier transforms that I had mastered with such difficulty in Maths 2 at Sydney University were no longer used in seismic data processing but had been replaced by bicubic splines.
Seismic data in the 70’s was still displayed on paper sections and horizons, faults, pinchouts and other features interpreted using coloured pencils. The seismic sections were folded and overlaid at marked intersection points to check ties. Two-way times to the interpreted horizons were picked off the seismic section using a ruler and annotated on a base map showing the location of the interpreted seismic lines and their shot points. The annotated times, and faults etc. were then hand contoured and, if time permitted, the resultant maps coloured by hand. If your interpretation was accepted by management, it might be redrafted in the drawing office by professional draftsmen on plastic film to enable multiple copies to be made. Some presentation copies would be coloured using water colours. These colours could be shaded to indicate dip. At best these maps were works of art and to be fair the whole process was perhaps more art than science. Certainly each interpreter’s contouring style was so distinctive that it was not necessary for a map to be signed to recognise its author.
At first the introduction of computers and automation was slow. Horizons could be interpreted on the screen but the process was not much more rapid than by hand and the screen size was much smaller than the paper sections. True the interpreted values could then be directly posted on a base map. But interpreted paper sections could also be rapidly digitised and the values posted. The seismic data was then 2D only and the lines by today’s standards widely spaced. The mapping programs of the day did not handle well the relatively dense data spacing in one direction and wide spacing in the other and most interpreters still preferred to hand contour their annotated maps. This gave them a chance for the contours to reflect what they believed was the geology and structural style of the area.
The introduction of 3D data sets changed everything! The complex structure of the 1980 Arauca oil discovery in northeast Colombia prompted one of the first 3D surveys to be carried out for Exxon and the last, to my knowledge, for which seismic data was displayed on paper. The rolls of paper cluttering up the hallways of the Houston seismic data processing office forced the change to computer displays.
3D data could be displayed as a cube with the ability to generate random vertical and horizontal slices. Horizons could be interpreted on horizontal time slices and the result was a time contour. Interpreting successive time slices could directly produce a time structure contour map. Faults and channels could usually be interpreted with more confidence on the horizontal time slices. It also now became possible to directly map the seismic attributes such as amplitude, frequency and phase of a horizon’s reflection. These parameters had been observed and measured on the wriggly traces displayed on seismic sections of the 60’s but to a miserably limited extent compared to the new 3D data sets.
The next step was the ability to generate horizon consistent time slices. This ability was developed separately by the different major oil companies and at first was a jealously guarded secret. In my own case it was discovered and developed at Esso Production Malaysia Inc. (EPMI) in the late 80’s. In our very high-quality seismic datasets from the South China Sea small time misties were observed in the water bottom reflections. The misties were very small only a few milliseconds and they were attributed to different tidal levels during the different times and dates of the recording survey. As a check, horizontal time slices were generated for the horizontal near surface layers below the sea floor. The results were unexpected and spectacular, resembling nothing so much as air photographs. The horizontal time slices showed river channels, swamps and beaches. Could such information be derived for the deeper structured horizons of economic interest? With the application of a modified statics program this could be done and the rest as they say is history.
A personal disappointment was the decision by most oil companies to use computer aided processing, display and interpretation until relatively recently as a device to do an interpretation more quickly rather than do it better. Often only a few weeks would be available to interpret a large 3D dataset with no time available to investigate alternative interpretations or investigate the seismic attributes thoroughly.
The latter part of my professional life was spent as a geophysical consultant working with both large (government) and small (private) companies with their very different challenges and opportunities. With the large companies it was possible to work on a basin wide scale, with the small, the chance to see a project through from seismic acquisition to well testing. I have never regretted my choice of career, in what other occupation would I have had the chance to travel the world and be paid for it! I have always been proud to work for an industry that, by providing affordable and reliable energy, has contributed to the dramatic reduction in global extreme poverty and the improvement of living standards experienced since the second World War.
I still believe that that PESA and the Oil and Gas industry have a future ( for the next 30 years at least) and am still active in our society and still serving on the NSW-ACT Branch executive as immediate past-president having recently handed over as president to the very capable Max Wiliamson.”
Phillip Cooney
Sydney, NSW, Australia
June 2026
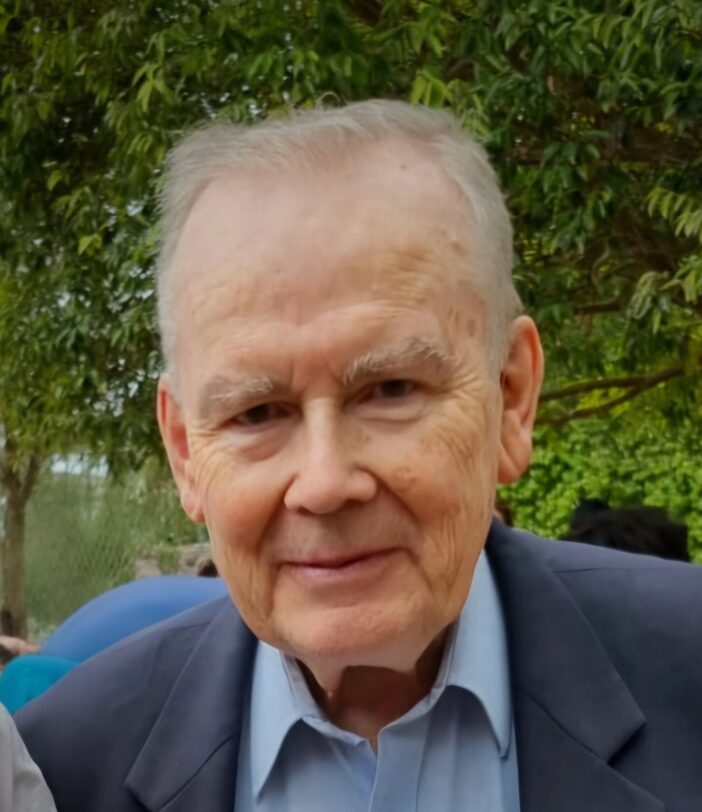
While definitely not the oldest member of PESA, there are at least a couple of 90 year-olds still around, Phillip thinks he may have the longest membership, having been drafted by Ken Richards at Esso Australia in 1969 to join the APEA (only one P then) Professional Division (founded in 1967), the predecessor of PESA. He was president of the NSW branch of that organisation in 1971-2 (elected by mistake, but that’s another story). The Professional Division was closely involved then in the preparation of the
APEA and then APPEA conferences, looking after the technical sessions. In the mid 70’s the Professional Division separated from APPEA to become PESA and in 1983 incorporated to become PESA Ltd. Phillip had the privilege of being one of the original members of PESA Ltd.
Phil spent the late 80’s and all the 90’s working overseas in South America and Southeast Asia. Returning to Australia in 1999, he was immediately redrafted, acting as president and/or secretary of the NSW branch for most of the 00’s. He served on the Federal Publications and Communications committee before and after acting as Federal Secretary in 2013-14 and again in 2021-22. He was very happy to have been associated with the creation of the fourth and current PESA website finally up and running in 2019.
Phil has been a very deserving winner of the PESA Meritorious Service Award in 2013 and the Distinguished Service Award in 2020. Whilst passing the baton for NSW/ACT branch on, he remains involved in the Publications and Communications committee and hopes to continue being an active member of PESA for the indefinite future.
Related Articles
20/07/2021

12/02/2025