LNG Shipping Market
The first half of 2021 witnessed an impressive volatility of the LNG shipping market. After being subdued across most of 2020, LNG spot charter rates for steam turbine carriers skyrocketed to the record highs of US$124,000 per day in January 2021, driven by two key factors.
This is according to Dr Aydar Shakirov, GECF Gas Transport and Storage Analyst, who said: First, amid colder-than-usual winter season LNG demand soared in many gas-consuming regions, which resulted in a surging demand for LNG carriers. Second, the congestions at the Panama Canal lowered availability of LNG carriers on the spot market. However, because of a slowdown in LNG demand, charter rates plunged to the annual low of $12,000 per day in early March 2021.

The shipping industry, including its LNG segment, faced a new black swan on 23 March 2021, when the containership Ever Given ran aground in the Suez Canal. That halted vessel traffic in the waterway, which averaged up to 50 transits per day, and brought a high level of uncertainty to the global markets.
The Suez Canal plays a crucial role in the global LNG transportation, connecting the Atlantic basin markets with Middle Eastern and Asia Pacific markets. In total, 686 LNG carriers, including laden and ballast ones, transited the Suez Canal in 2020. This number included 388 laden LNG carriers passing through the waterway, representing 7% of global LNG shipments. A total of 276 laden LNG carriers passed through the Suez Canal in the east-to-west direction, with almost all of them delivering LNG from Qatar to Europe, mainly to Italy and UK. At the same time, 112 laden LNG carriers sailed via the waterway from west-to-east, with most of them delivering Russian and US LNG cargoes to Asia Pacific. The Suez Canal is actively used for transportation of Russian cargoes to Asia (with prior transshipment in Europe) from February to May, when the Northern Sea Route is closed due to high ice thickness, and US cargoes to Asia because of congestions at the Panama Canal. Laden LNG carriers transported over 32 million tonnes per annum (mtpa) through the waterway, which represented 3% of the overall tonnage transiting the Suez Canal, while the share of crude and oil products reached 23%.
The blockage resulted in 370 vessels waiting to transit the Suez Canal. Among them, there were 16 LNG carriers.
Soaring costs
Since there was no clear understanding of how long it would take to eliminate the disruption, some LNG carriers took alternative routes for cargo transportation, mainly travelling around the Cape of Good Hope in Africa. That resulted in higher shipping costs because of longer shipping times with LNG delivery from Middle East to Europe rising to 27 days, or 10 additional days compared to delivery through the Suez Canal. In the meantime, other LNG carriers preferred to wait for a solution to the transit crisis.
The Suez Canal blockage lasted for a week, with the containership refloated and vessel traffic restarting on 29 March 2021. In this context, a large-scale disruption to the LNG shipping market was prevented. While the transportation of crude and oil products was affected to a greater extent, with the market witnessing a significant rise in freight rates, the blockage had a limited impact on the global gas market.
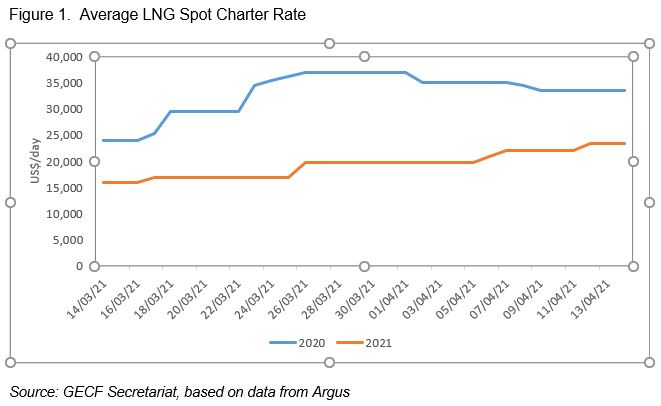
It resulted in the delayed deliveries of various LNG cargoes. However, the delays did not have a strong upward pressure on LNG spot charter rates. They increased only by $3,000 to $20,000 per day over the period of the blockage, remaining much lower than a year earlier. First, the timing of the blockage was not critical for the LNG market, which was entering the shoulder season with lower LNG demand. Second, there was no shortage of shipping capacity on the market, with various LNG carriers commissioned in early 2021. Besides, LNG carriers stuck in the Canal were likely to be chartered on medium- and long-term basis, with the blockage not affecting the availability of LNG carriers on the spot market. In this context, the blockage impacted mainly LNG loading and discharging schedules in various ports, however the LNG shippers could catch up on these later.

That said, it is worth noting that if the blockage had been longer or had happened in the winter season, its impact on gas markets could have been greater, with tightening LNG supply, lifting spot charter rates, and rising spot LNG prices.
In the second half of April 2021, LNG spot charter rates reached $50,000 per day and stayed at this high level throughout May, which is not typical for that season. However, this had nothing to do with the Suez Canal blockage.
The Suez Canal disruption demonstrated that the global trade, including its LNG segment, highly depends on this crucial trade route, while alternative routes are inconvenient and more costly. As such, any disruption at the waterway may have severe consequences for all stakeholders, including the GECF Member Countries.
It is highly unlikely that the LNG industry will opt for alternative trade routes because of this accident, however the relevant risks should be taken into account and managed. First, supply and charter contracts may envisage a fair split of additional transportation costs, driven by delays in LNG delivery due to disruptions at the Suez Canal between LNG exporters, importers, and shipping companies. Second, charter contracts may include alternative trade routes, such as the Cape of Good Hope, in case of transportation disruption at the Suez Canal. Third, LNG importing countries may prioritise the development of gas storage, including underground and LNG segments, to avoid supply disruption in case of such accidents.
Argus LNG Daily.
ICIS LNG Edge.
LNG Transit Disrupted at the Suez Canal. Wood Mackenzie, March 2021.
LNG World Shipping (http://www.lngworldshipping.com).
Seven LNG Tankers Diverted after Suez Canal Blockage. Reuters, 26 March 2021.
Suez Canal Maintained Volumes in 2020 and Extends Incentives for 2021. The Maritime Executive, 4 January 2021. The Latest LNG Shipping News (https://www.lngindustry.com/lng-shipping).


