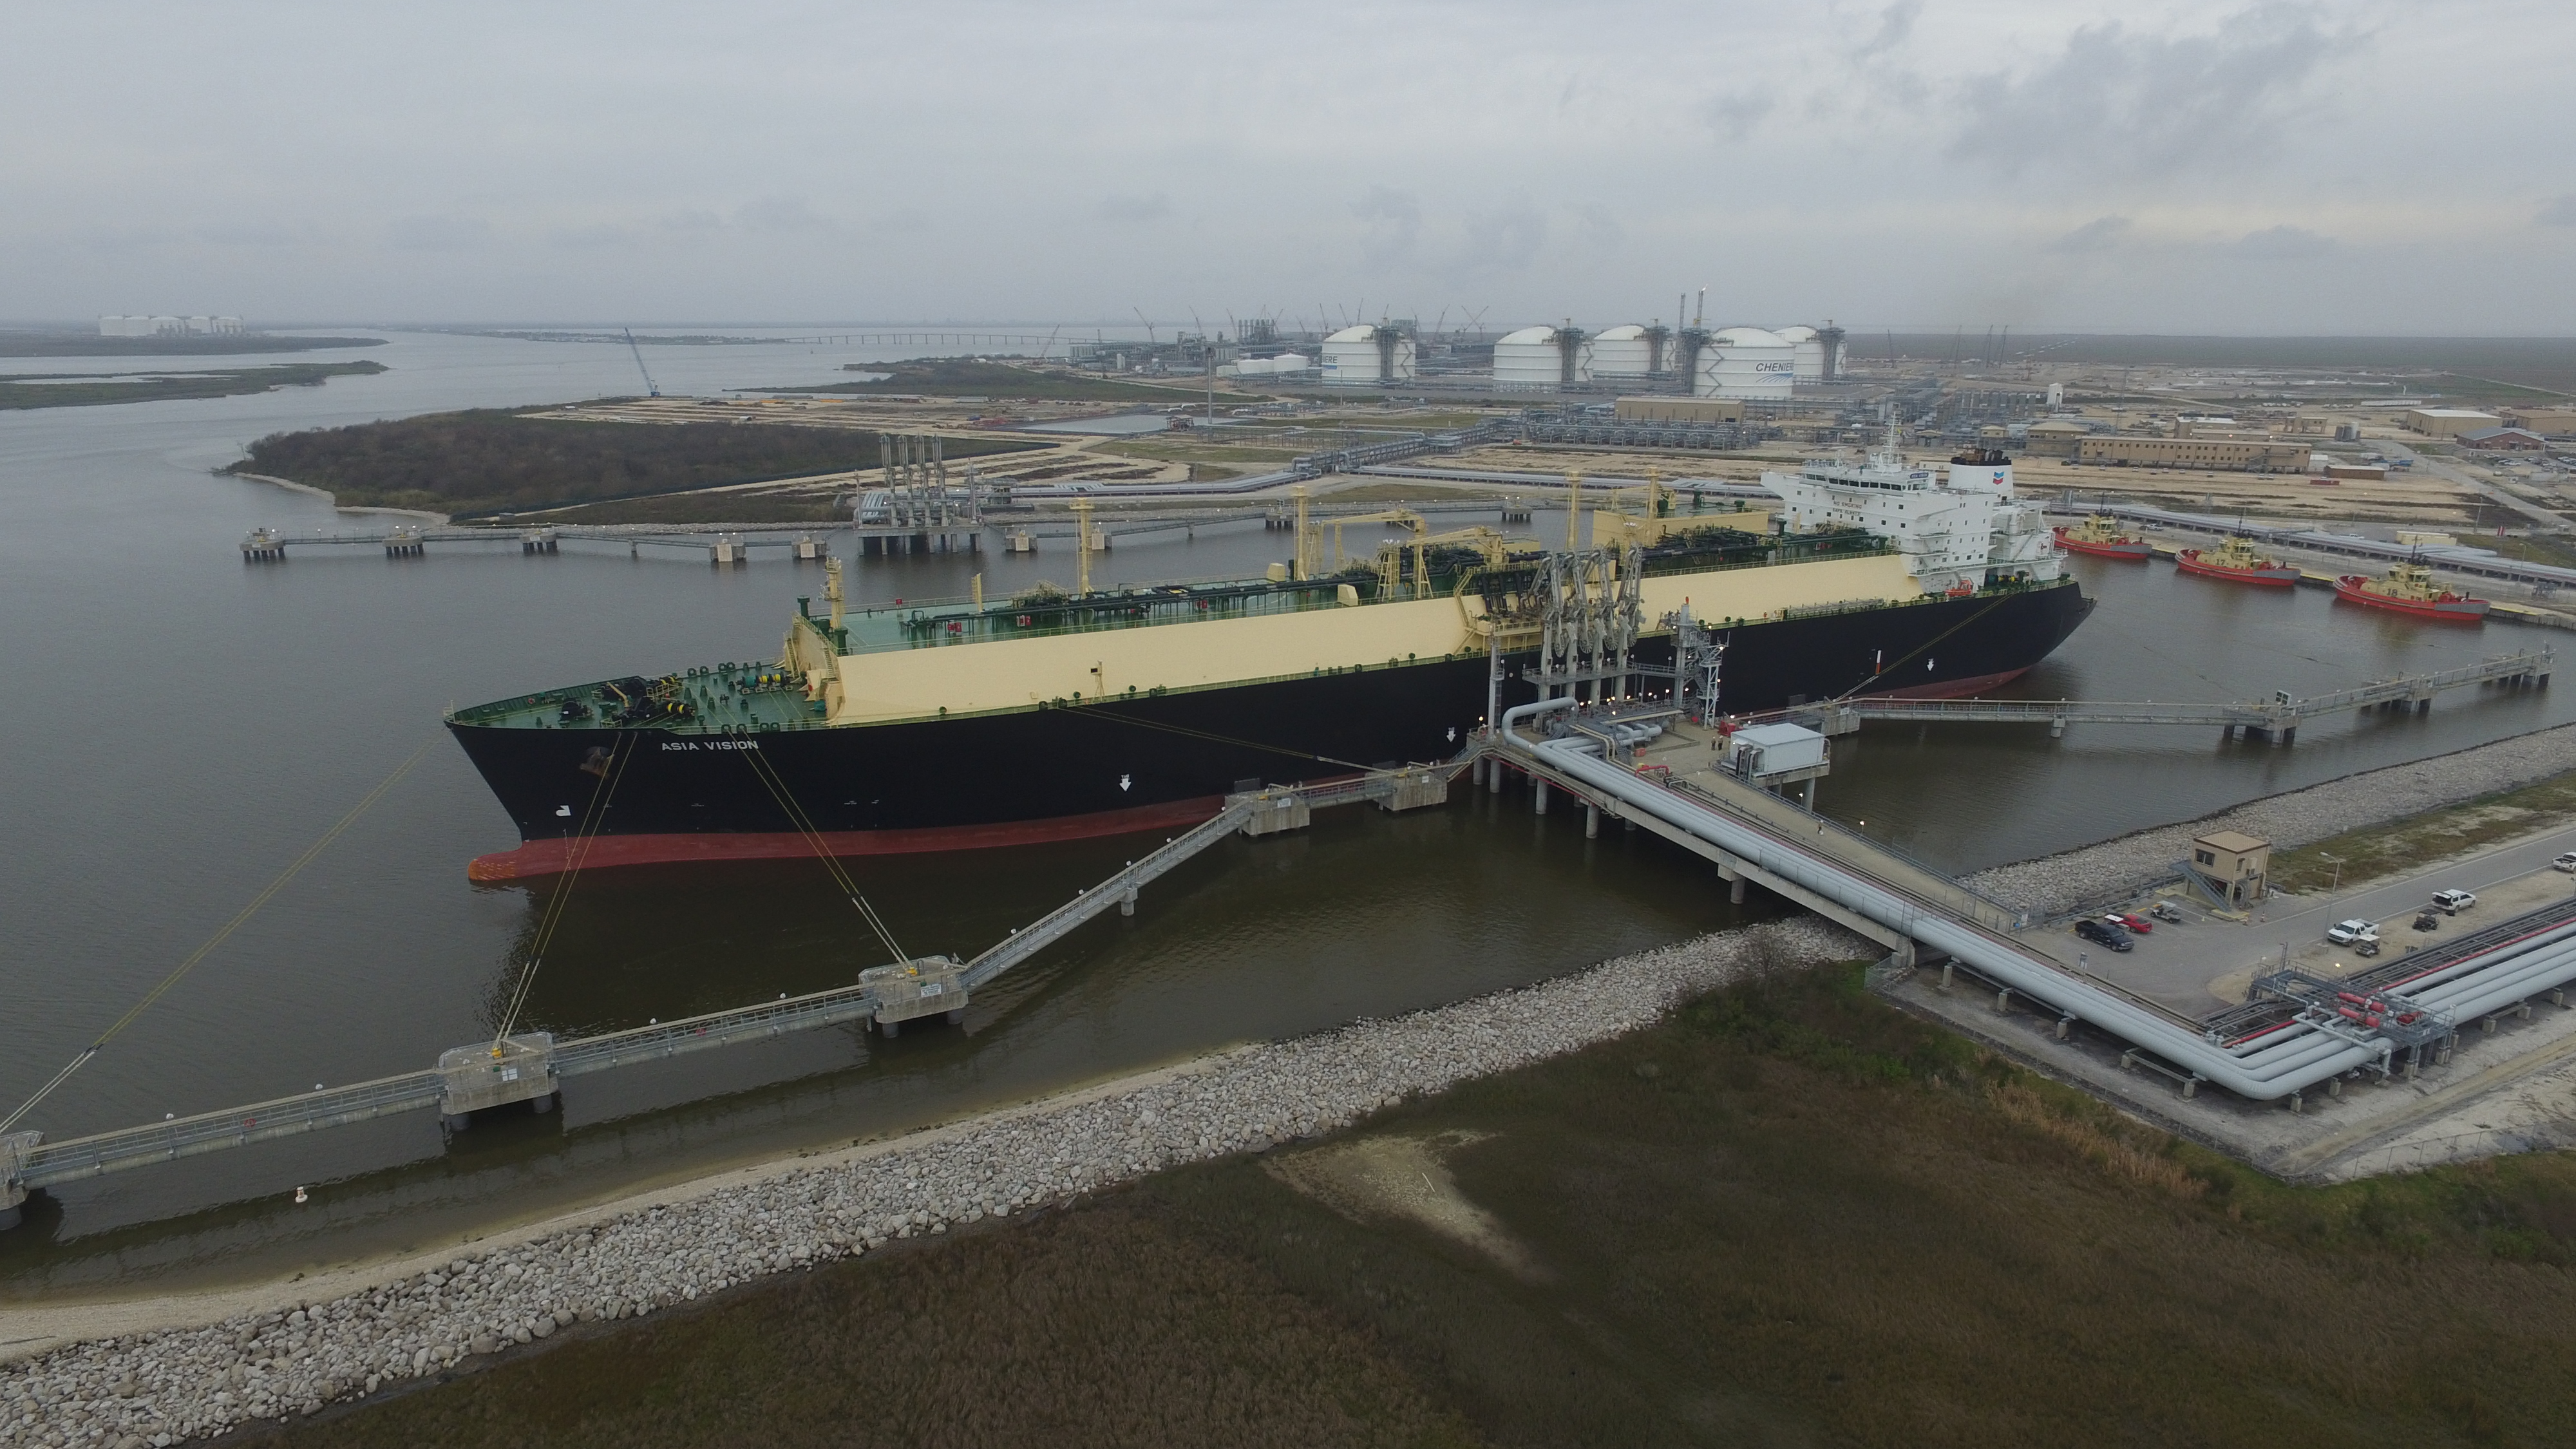
China lost its position as Australia’s top LNG export destination in FY 2022 with 25.0 Mt (38%) of Australian export volume, less than 28.3 Mt (41%) in FY 2021.
This was revealed in EnergyQuest’s June LNG report, which said that In the 11 months to May Chinese LNG imports decreased by 4% while imports from Australia fell by 12% to 25.0 Mt from 28.3 in the corresponding period in 2021. As a result, the Australia’s market share fell to 38% from 41% a year earlier.
The fall in Australian China deliveries of 3.3 Mt was the largest of any supplier to China and was offset by increased China deliveries from Qatar (+2.3 Mt) and the US (+1.0 Mt).
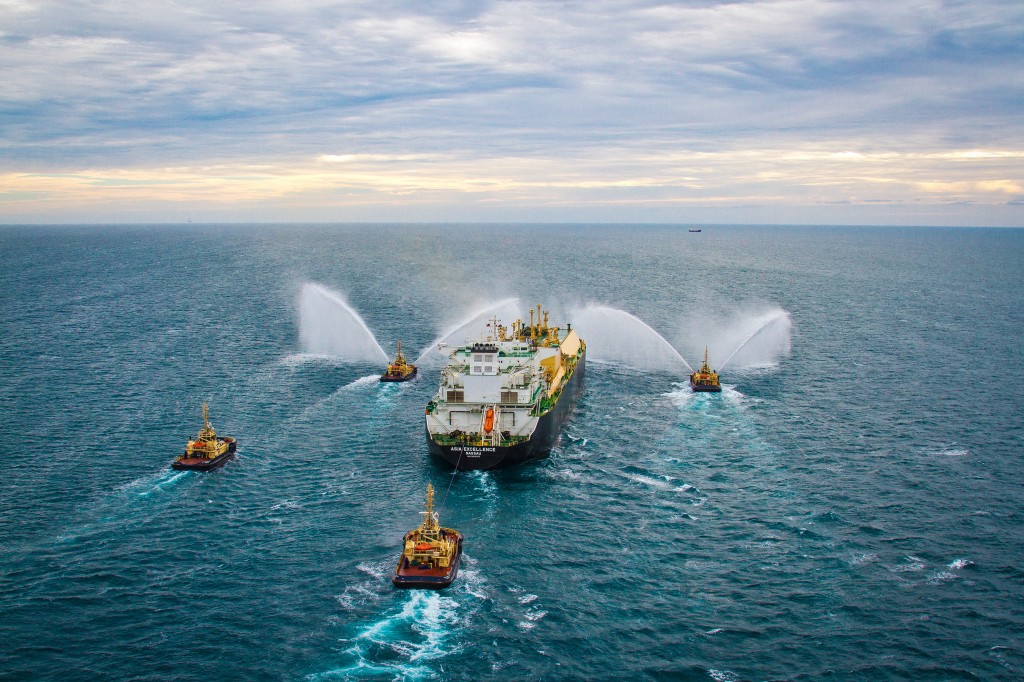
However, EnergyQuest estimates Australia exported a record 82.6 Mt of LNG in the 12 months to 30 June 2022, well up on the 77.3 Mt in FY 2021, and more than the previous record set in FY 2020 of 79.3 Mt.
Some of the other highlights of the report were:
- In June Australian projects shipped a record 7.31 million tonnes (Mt) (106 cargoes), up on the 6.91 Mt (101 cargoes) in May and higher than the previous record of 7.2 Mt in October 2021.
- EnergyQuest estimates that Australian LNG export revenue increased in June to a record $7.18 billion, up from $6.38 billion in May and up by 135% on June 2021.
- Compared with May, Australian projects delivered 7 fewer cargoes to China, Korea and Japan in June. There were no cargoes delivered to Europe.
- In June, 27 cargoes were delivered to China after delivering 29 in May and 34 in June 2021.
- Thirty-seven deliveries were made to Japan in June, after 43 were delivered in May and 26 delivered in June 2021.
- Australia delivered 13 cargoes to Korea in June, up from 12 in May and up on the deliveries of last year when 10 cargoes were delivered.
- West Coast shipments increased to a record 5.5 Mt in June (5.0 Mt in May), with 79 cargoes in June compared to 72 in May. West coast projects operated at 107% of nameplate capacity during June.
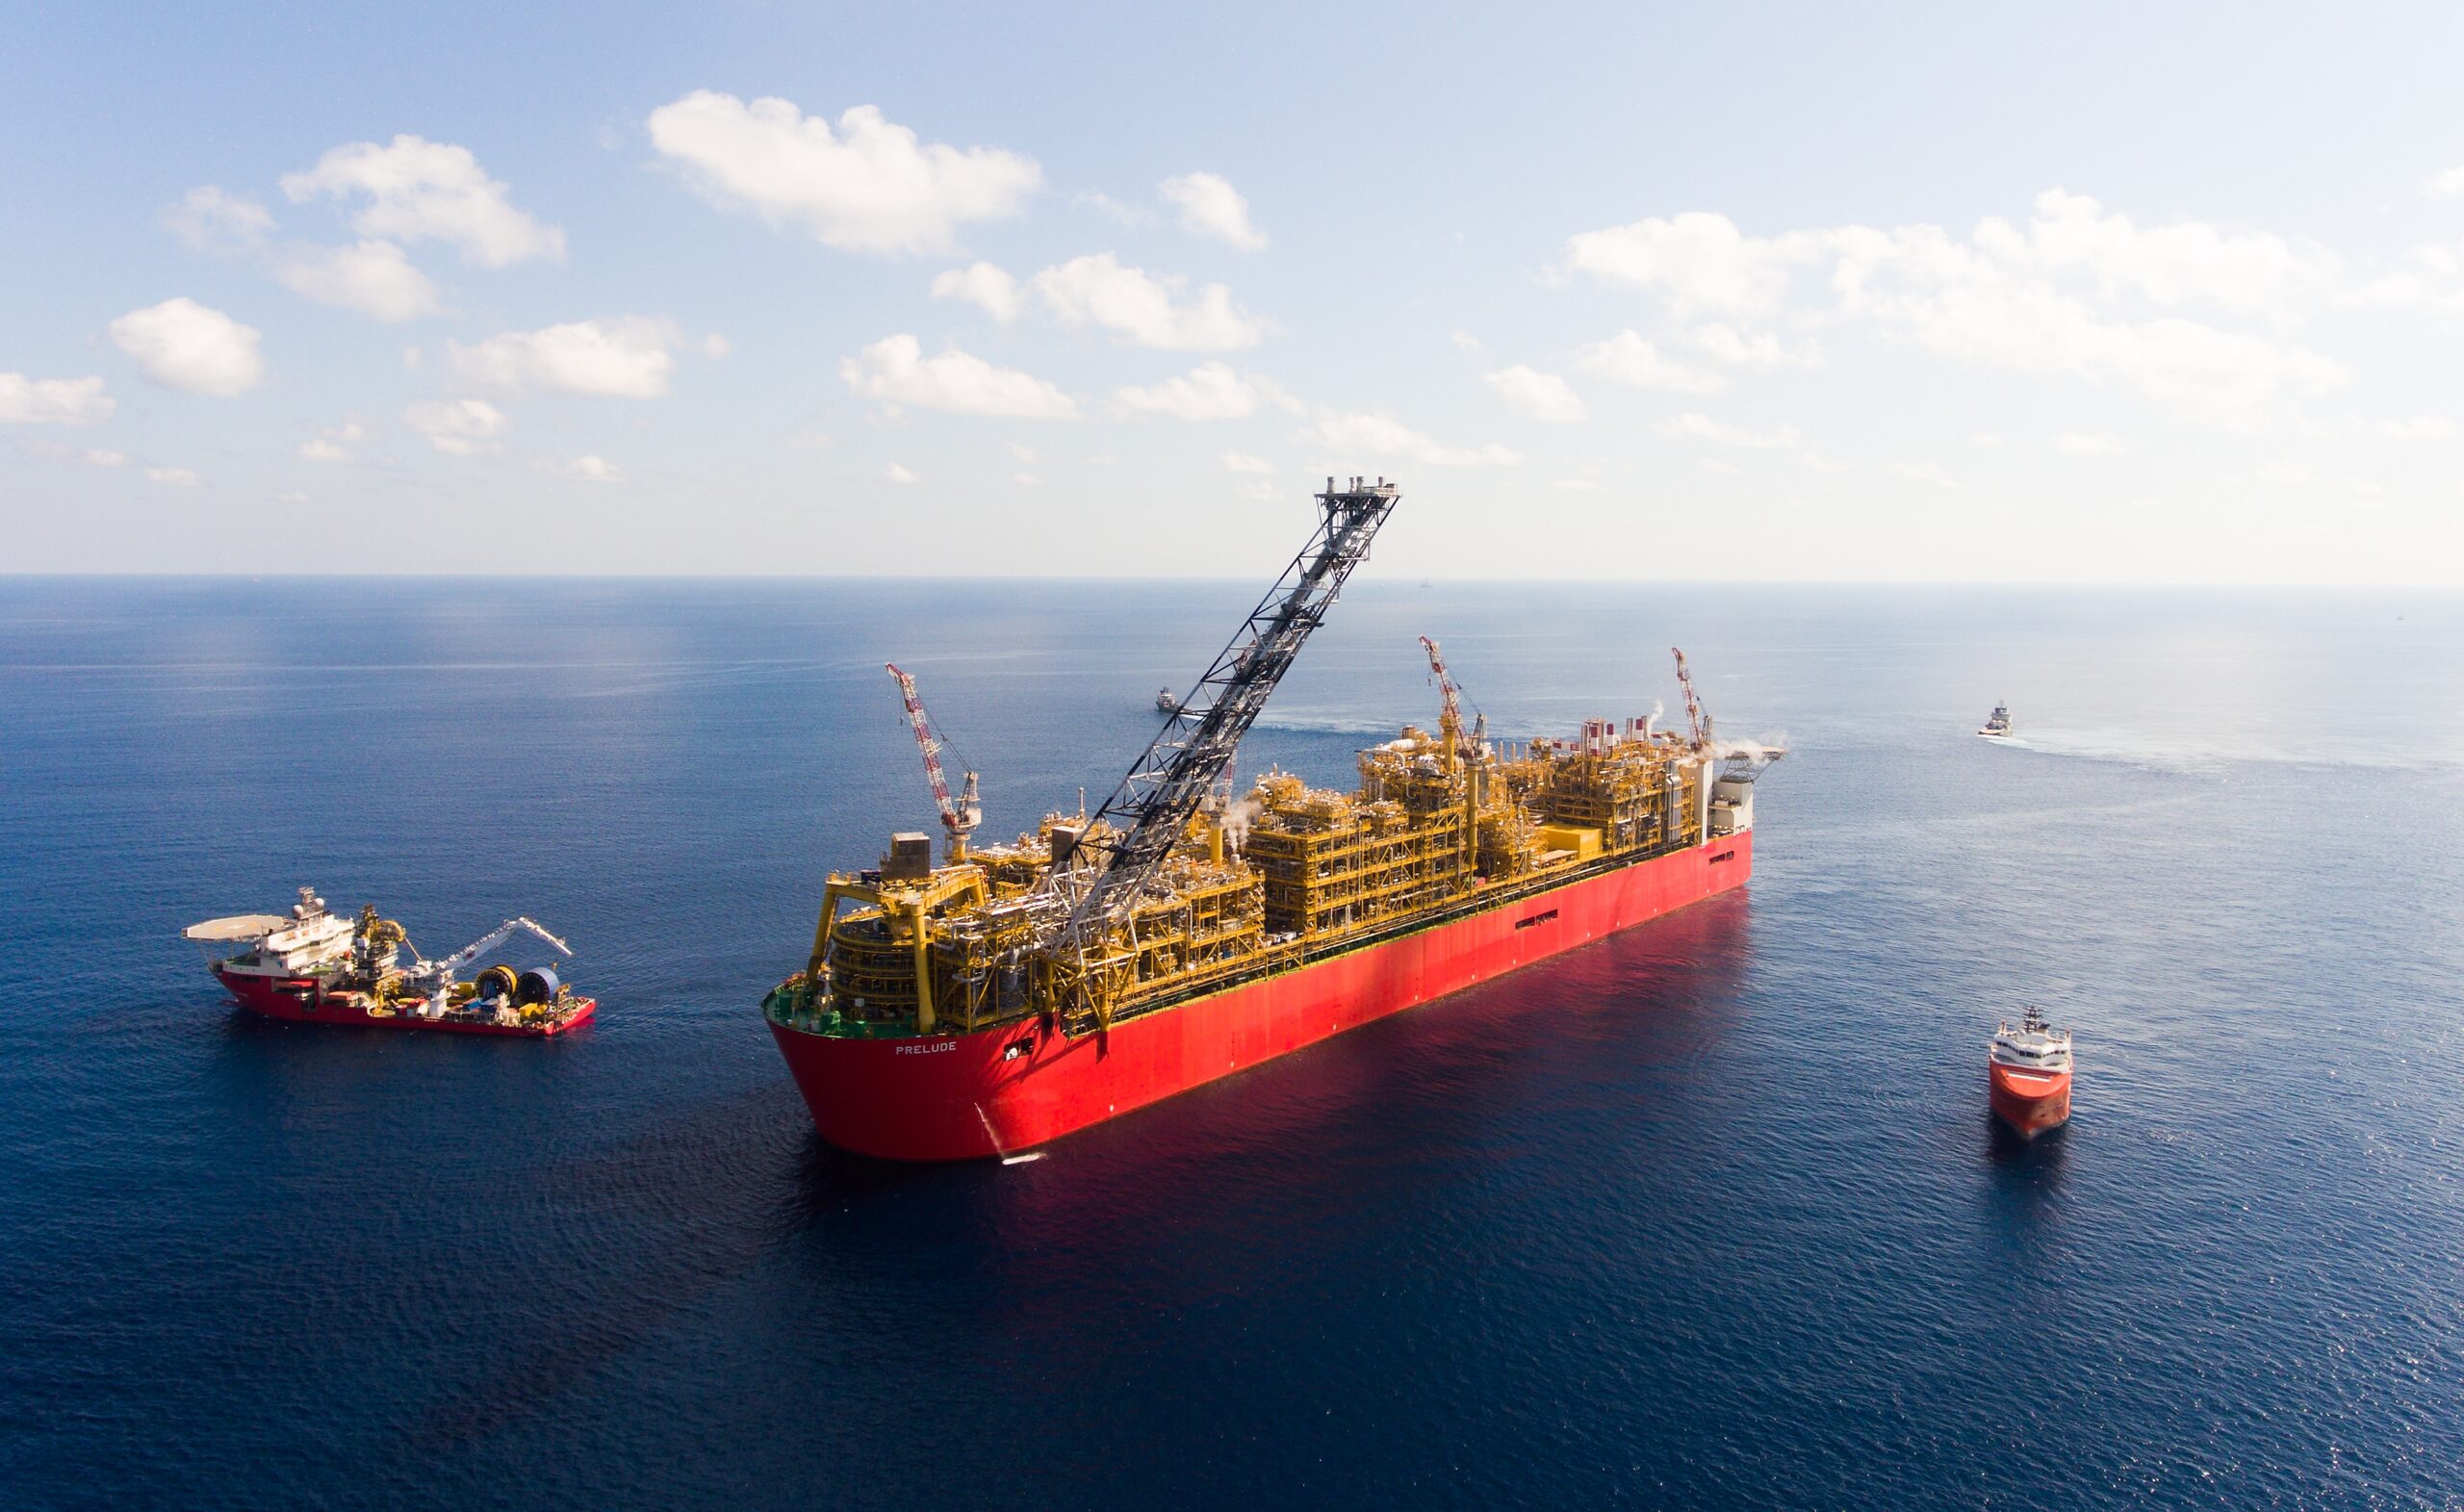
- Prelude FLNG shipped 4 cargoes in June after shipping 4 cargoes in May despite strike action late in June.
- East coast LNG shipments decreased to 1.8 Mt in June (1.9 Mt in May), with 27 cargoes compared to 29 in May, and 27 cargoes of 1.8 Mt a year ago. The east coast projects operated at 84 % of nameplate capacity during June.
- There were four spot cargoes reported for shipping from Australian projects in June, two spot cargoes from the east coast and two spot cargoes from the west coast (4% of total shipments). There were five spot cargoes in May.
- Queensland exported gas to the other states in June, with net flows in a westerly direction. Westerly flows were seen for the entire month. Net gas flows from Queensland to other states were 6.2 PJ in June.
- CSG production from fields operated by the LNG producers was 107.6 PJ in June, lower than 117.1 PJ in May but 1.7 PJ above exports including fuel gas. In May the producers had a surplus of 4.8 PJ.
- Queensland short-term domestic gas prices in June were significantly higher averaging $36.85/GJ ($28.68/GJ in May) at Wallumbilla and $37.93/GJ ($31.67/GJ) in Brisbane. Southern short-term domestic gas prices in June were higher compared to those in May, averaging $40.70/GJ ($29.87/GJ) in Sydney, $39.88/GJ ($33.44/GJ) in Adelaide and $38.82/GJ ($32.95/GJ) in Victoria.
- Power generation in June from coal fell to a record low for this time of year, with generation down by 747 GWh from a year earlier, and down slightly on May. The coal share of NEM generation fell to 56%, down from 63% a year earlier, with lower generation in NSW and Victoria.
- Gas generation was up by 166 GWh from a year earlier. Gas-fired generation increased in NSW, Queensland, South Australia and Victoria compared with May. Gas-fired generation decreased in Tasmania compared with May. Gas’s overall share of the market increased to 10.8% from 10.2% a year earlier. Gas had an 11.3% share in Queensland and 42% in South Australia. Gas-use for power generation was up by 1.42 PJ in June (8%) compared with a year earlier.

