Author | Chris Cubitt: Geological Survey of South Australia
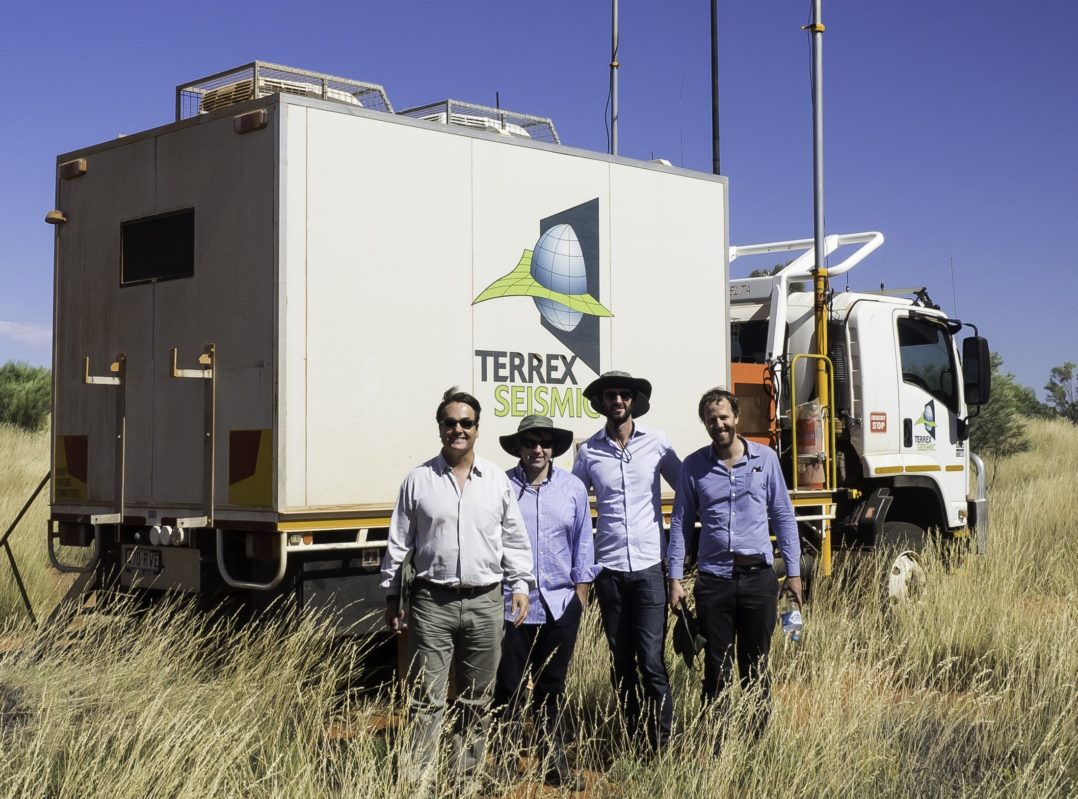
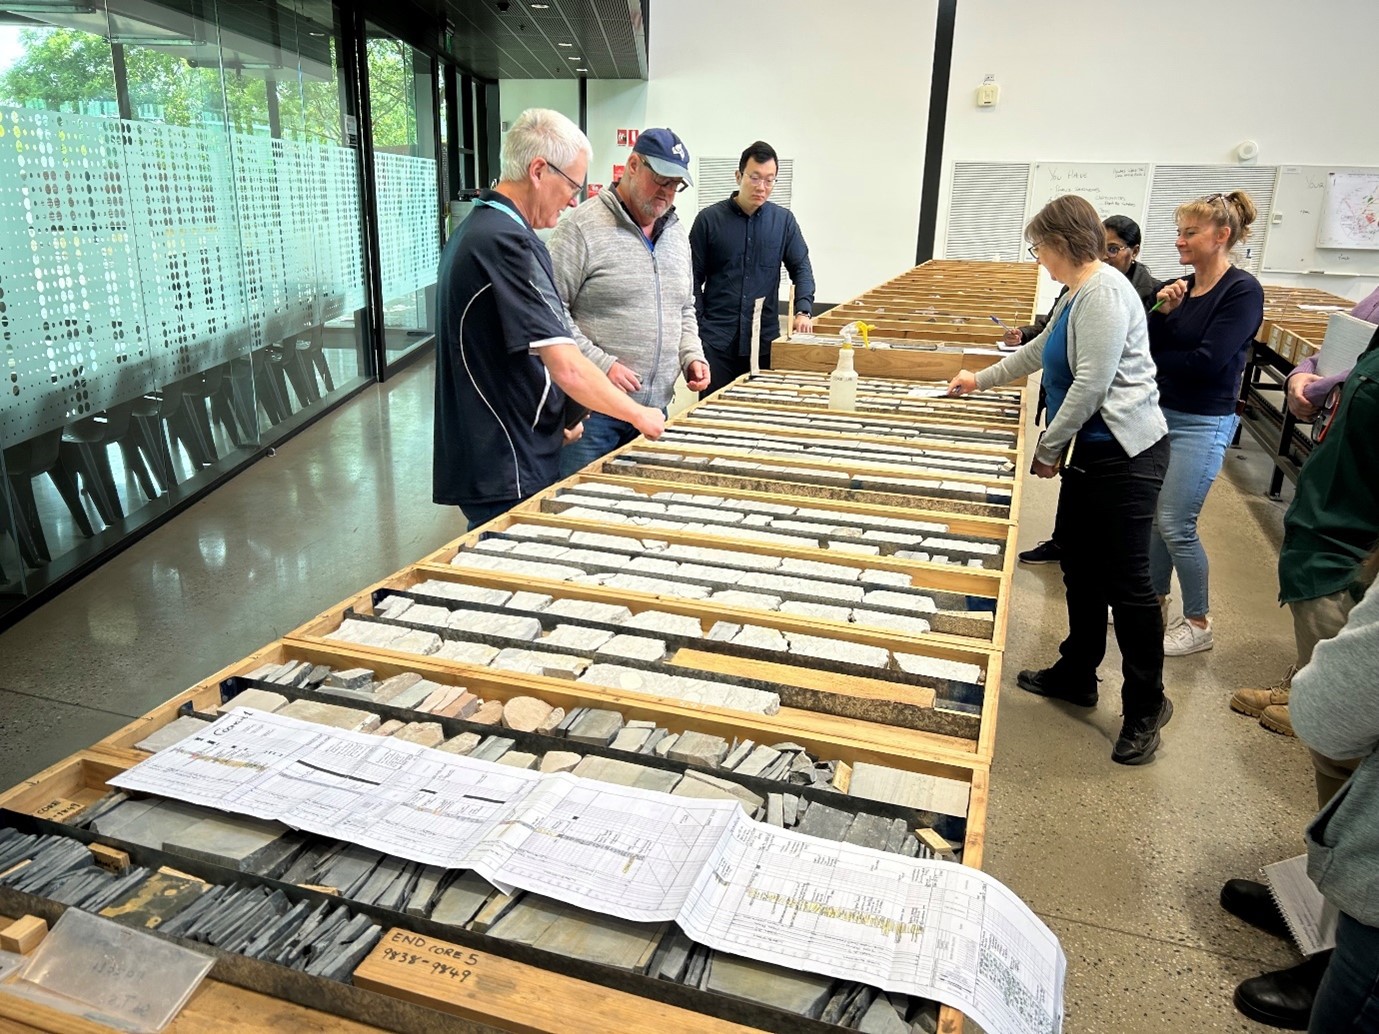
Chris Cubitt of the Geological Survey South Australia (GSSA), hosted the 2026 PESA SA/NT core workshop at the SA Drill Core Library on Friday November 21st, 2025, (Fig. 1). This year’s event was well attended by industry, government and academia focussing on the eastern Warburton Basin (Daralingie Shelf area) with the aim to produce a quick look GDE map and form an opinion on the basin’s prospectivity. Five hundred meters of core was displayed from 32 wells across the basin (Table 1) being outlaid north to south to approximate well/core locations (see Fig. 4 for well locations).

The Cambrian aged eastern Warburton Basin (Warburton) underlies the bulk of the hydrocarbon-producing Cooper Basin in northeast South Australia. The Warburton, like the Cooper Basin, is hydrocarbon-bearing with a significant catalogue of hydrocarbon shows recorded from a wide variety of lithologies and stratigraphic intervals (Sun and Gravestock, 2001 and Kirk et al., 2025). The basin was the focus of early exploration in the Cooper region but in subsequent decades the exploration focus has moved to the overlying Cooper and Eromanga Basins.
A new study was completed in 2025 by the GSSA across the Daralingie Shelf, building on prospectivity work done in the early 2000s (Radke 2009, Sun 1996, Sun and Gravestock 2001) which aimed to shine a new light on this basin (Kirk 2025, Kirk et al., 2025 and Rady et al., 2025). This study consisted of three parts, (1) a seismic stratigraphy study (Kirk, 2025) which has defined a new stratigraphic architecture; (2) Gross Depositional Environment (GDE) mapping and prospectivity assessment (Rady et al., 2025); and (3) a core interpretation study (Cubitt and Tiainen 2026)1. This PESA workshop was developed from the core interpretation part of the greater GSSA project.
The workshop consisted of two parts; a morning session whereby the lithologies of cores were discussed (Fig. 2) and an afternoon session where gross depositional environments were interpreted (Fig. 3) and then hand drawn maps created (Fig. 4)2. Mapping teams were then asked to present their maps to the entire group focussing on areas of potential prospectivity.
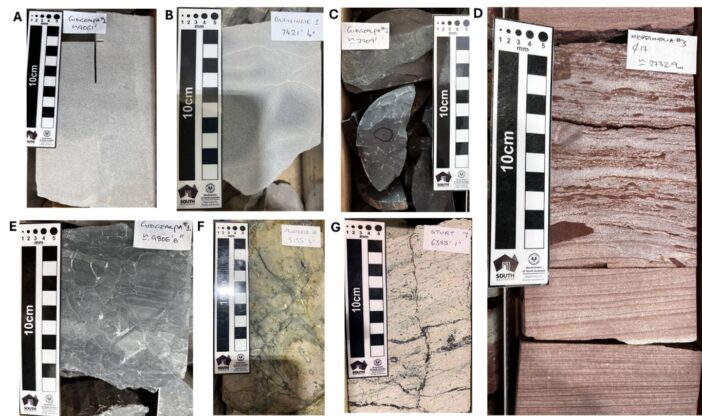
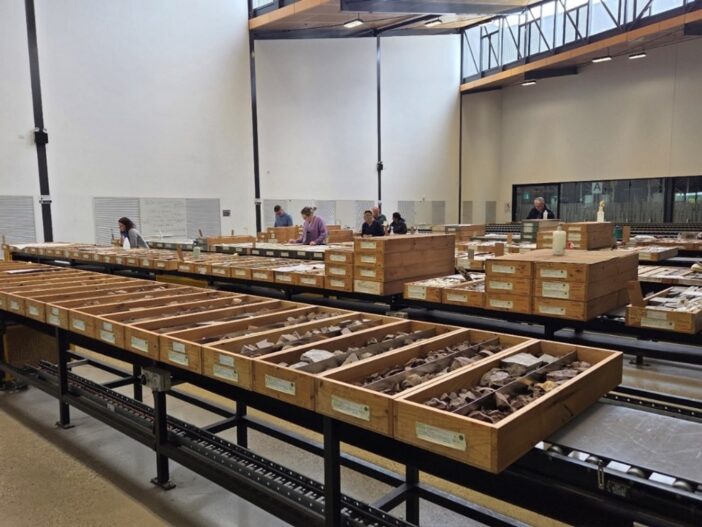
In the first two hours of the morning the group was guided through all of the main lithologies (sandstones, quartzites, claystones, heterolithics, limestones, basalts and ignimbrites – illustrated in Fig. 2) following which participants spent the rest of the morning describing lithologies in the remaining wells (Fig.3).
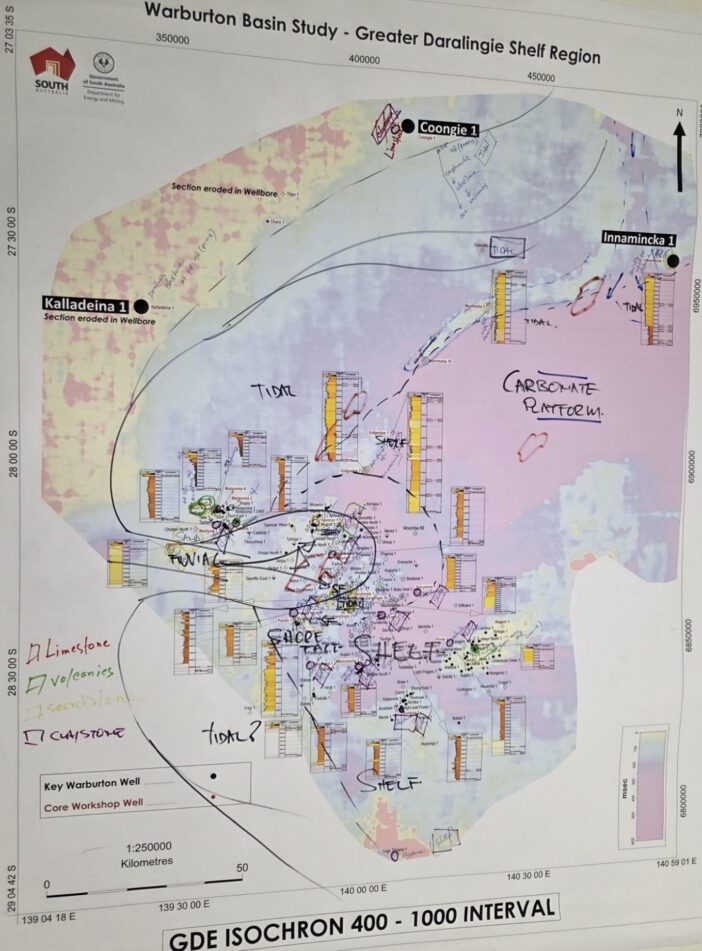
Following lunch participants were split into teams, given a data pack including core logs and a 400-1000 interval GDE base map (Fig. 4) which consisted of the 400-1000 isochron and (gamma) well signatures with core intervals annotated. Once in teams the participants combined their lithology observations and annotated the GDE base maps (see Fig.4 for an example). Then the participants started tackling depositional environment (DE) interpretations, combining like-for like DEs incorporating the wireline motif and assigning a gross depositional environment (GDE) for the entire 400-1000 section at each well location.
This process was done and the map constructed one well at a time. The participants were encouraged to make DE and GDE interpretations focusing on the sedimentary processes preserved in cores and using these “depositional hooks” to make rapid interpretations. The main depositional hooks included meta-sandstones with a coarsening wireline curve (indicative of deltaic deposition), double mud drapes (tidal process), muddy carbonates (platform carbonates), claystones (shelf). Some of the key technical points from the day include:
Quick look Core
- Describe first – consistently describe oil staining, lithology, grainsize, obvious sedimentology features. Are fractures present open or closed, are there fracture swarms?
- Interpretation comes second – focus on depositional hooks (see the discussion above). The most fundamental aspect to think about is the depositional energy that is needed to make the rock you are looking at.
- Scale up – look at the core intervals and divide into GDE intervals.
Quick look GDE map making
- With respect to each interval, annotate on a base map the dominant lithology at any given well location.
- Once all lithology data is annotated to the base map add other data (if possible) such as well signatures, seismic facies, isopachs, isochrons, biostratigraphic environmental information. Put data on your map that will help your interpretation!
- Now look at the spatial distribution of information on your base map. Can you see trends? In the Figure 4 example, we can see a group of wells to the south that are dominated by shelfal claystones and then in the middle of the map meta-sandstones surrounded by heterolithics and extrusive volcanics. If we extend our view, we see carbonates in the northern part of the basin.
- We can now start drawing lines that divide these lithologies and should start seeing trends, the beginnings of a depositional concept. We should now start thinking about the most likely juxtaposition of depositional systems remembering we are looking at a time slice. Don’t expect things to jump out. It might take several attempts to get a GDE sketch that makes geological sense Don’t be afraid to draw the first line! Done be afraid to erase lines and play with differing concepts. Look again at your core (images), wireline and seismic information. Iterate!
- Remember you are combining the geology of a given interval and trying to capture the main depositional systems. Draw your GDE map at the most progradational moment in the interval.
At day’s end each team presented their GDE maps (an example is illustrated in Fig.4) with questions and discussions from the broader audience. It became clear that all three teams interpreted variations of the same GDE map demonstrating that by following simple pragmatic steps a quick look regional geology map based on (integrated) hard data is possible. Also, it is interesting that the three teams came up with similar interpretations, a situation that doesn’t often occur!
Final statement
It is hoped that participants have a fresh view of the Warburton Basin cores in this often-overlooked basin. Also, it is hoped that the participants have learned how to approach cores (as no-specialists) and how to bring core interpretation early into project workflows, even in a complex basin like the Warburton. Looking at your cores early will help underpin your project and ground truth wireline and seismic interpretations.
The participants of the 2025 PESA SA/NT core workshop managed to digest 500m of core from across an entire basin, integrate wireline/seismic data and draw a whole-of-basin GDE map. Now that was one hell-of-a-day in the Tonsley core shed!
References
Cubitt C. and Tiainen S. (in prep 2026) Conventional core interpretation, onshore Warburton Basin, Daralingie Shelf, South Australia, DEM report book (in prep).
Kirk R. (2025) Seismic stratigraphy of the Cambrian Eastern Warburton Basin, South Australia. DEM Report Book RB 2025/00020. RB 2025/00020 Seismic stratigraphy of the Cambrian Eastern Warburton Basin, South Australia – Document – SARIG catalogue
Kirk R., Rady T., Cubitt C., Grasso C. and Tiainen S. (2025) Sequence stratigraphy of the Cambrian Eastern Warburton Basin. AEGC conference Perth 2025
Radke B. (2009) Hydrocarbon and geothermal prospectivity of sedimentary basins in Central Australia Warburton, Cooper, Pedirka, Galilee, Simpson & Eromanga basins. Geoscience Australia Record 2009/25
Rady T., Kirk R., Grasso C., Cubitt C. and Tiainen S. (2025) New insights into the prospectivity of the Eastern Warburton Basin. AEGC Conference Perth 2025.
Sun X. (1996) Sequence stratigraphy, biostratigraphy and palaeontology of the eastern Warburton Basin (Palaeozoic). Unpublished PhD (NCPGG) Adelaide University.Sun X. and Gravestock D. (2001) Potential hydrocarbon reservoirs in upper levels of the eastern Warburton Basin, South Australia. Report Book 2001/016 Primary Industries and Resources South Australia (now DEM). Warburton Basin | Energy & Mining
Acknowledgements
We would like to thank the South Australia Drill Core library staff for core handling and arranging the outlay of wells from south to north. Not an easy task! Also, a special thanks to Jo-Anne Hart for preparing the GDE base maps and Bronwyn Camac for reviewing this manuscript. The South Australian Department for Energy and Mining management are thanked for their support of this workshop and this publication. This product is released under the Creative Commons Attribution 4.0 International License.
[1] Note the core interpretation study commenced at the beginning of the project to provide controls on seismic interpretation
[2] The uppermost Warburton interval (400-1000), as defined by DEM’s recent work (Kirk, 2025 and Rady et al, 2025) was the target for mapping and prospectivity.
Related Articles