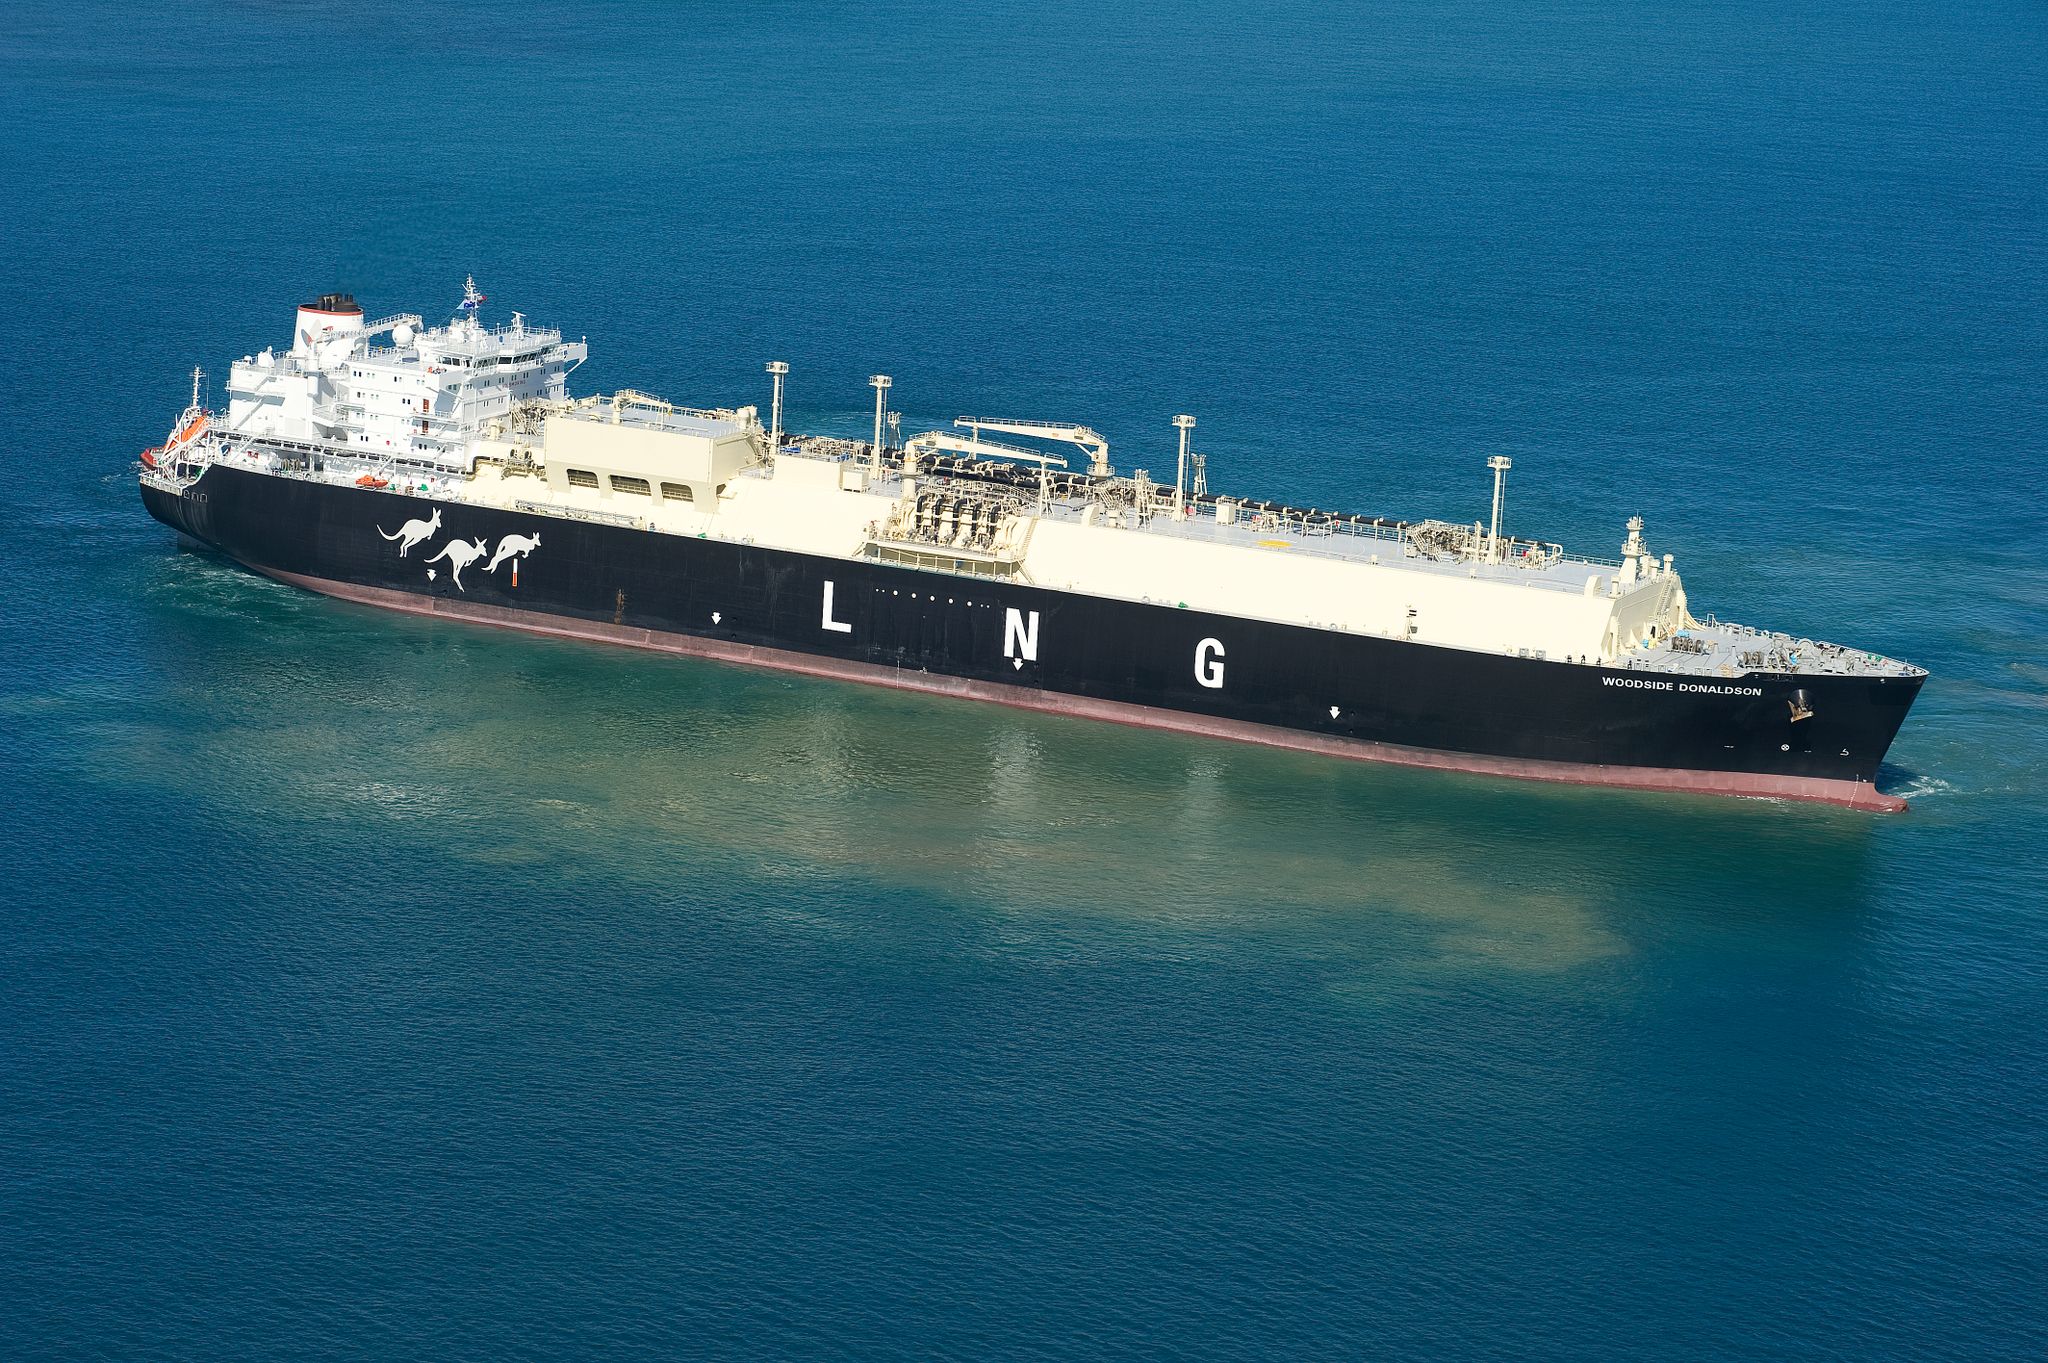
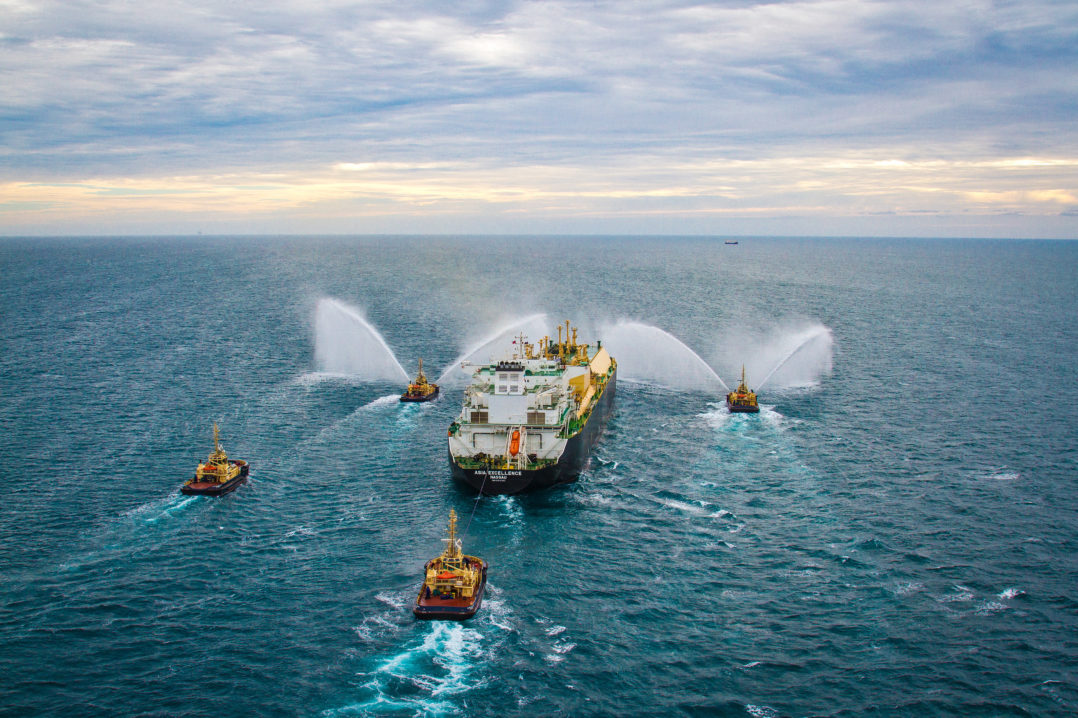
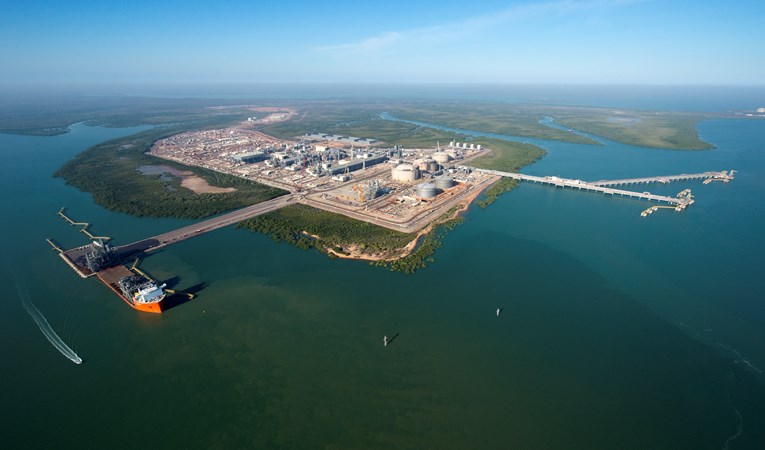
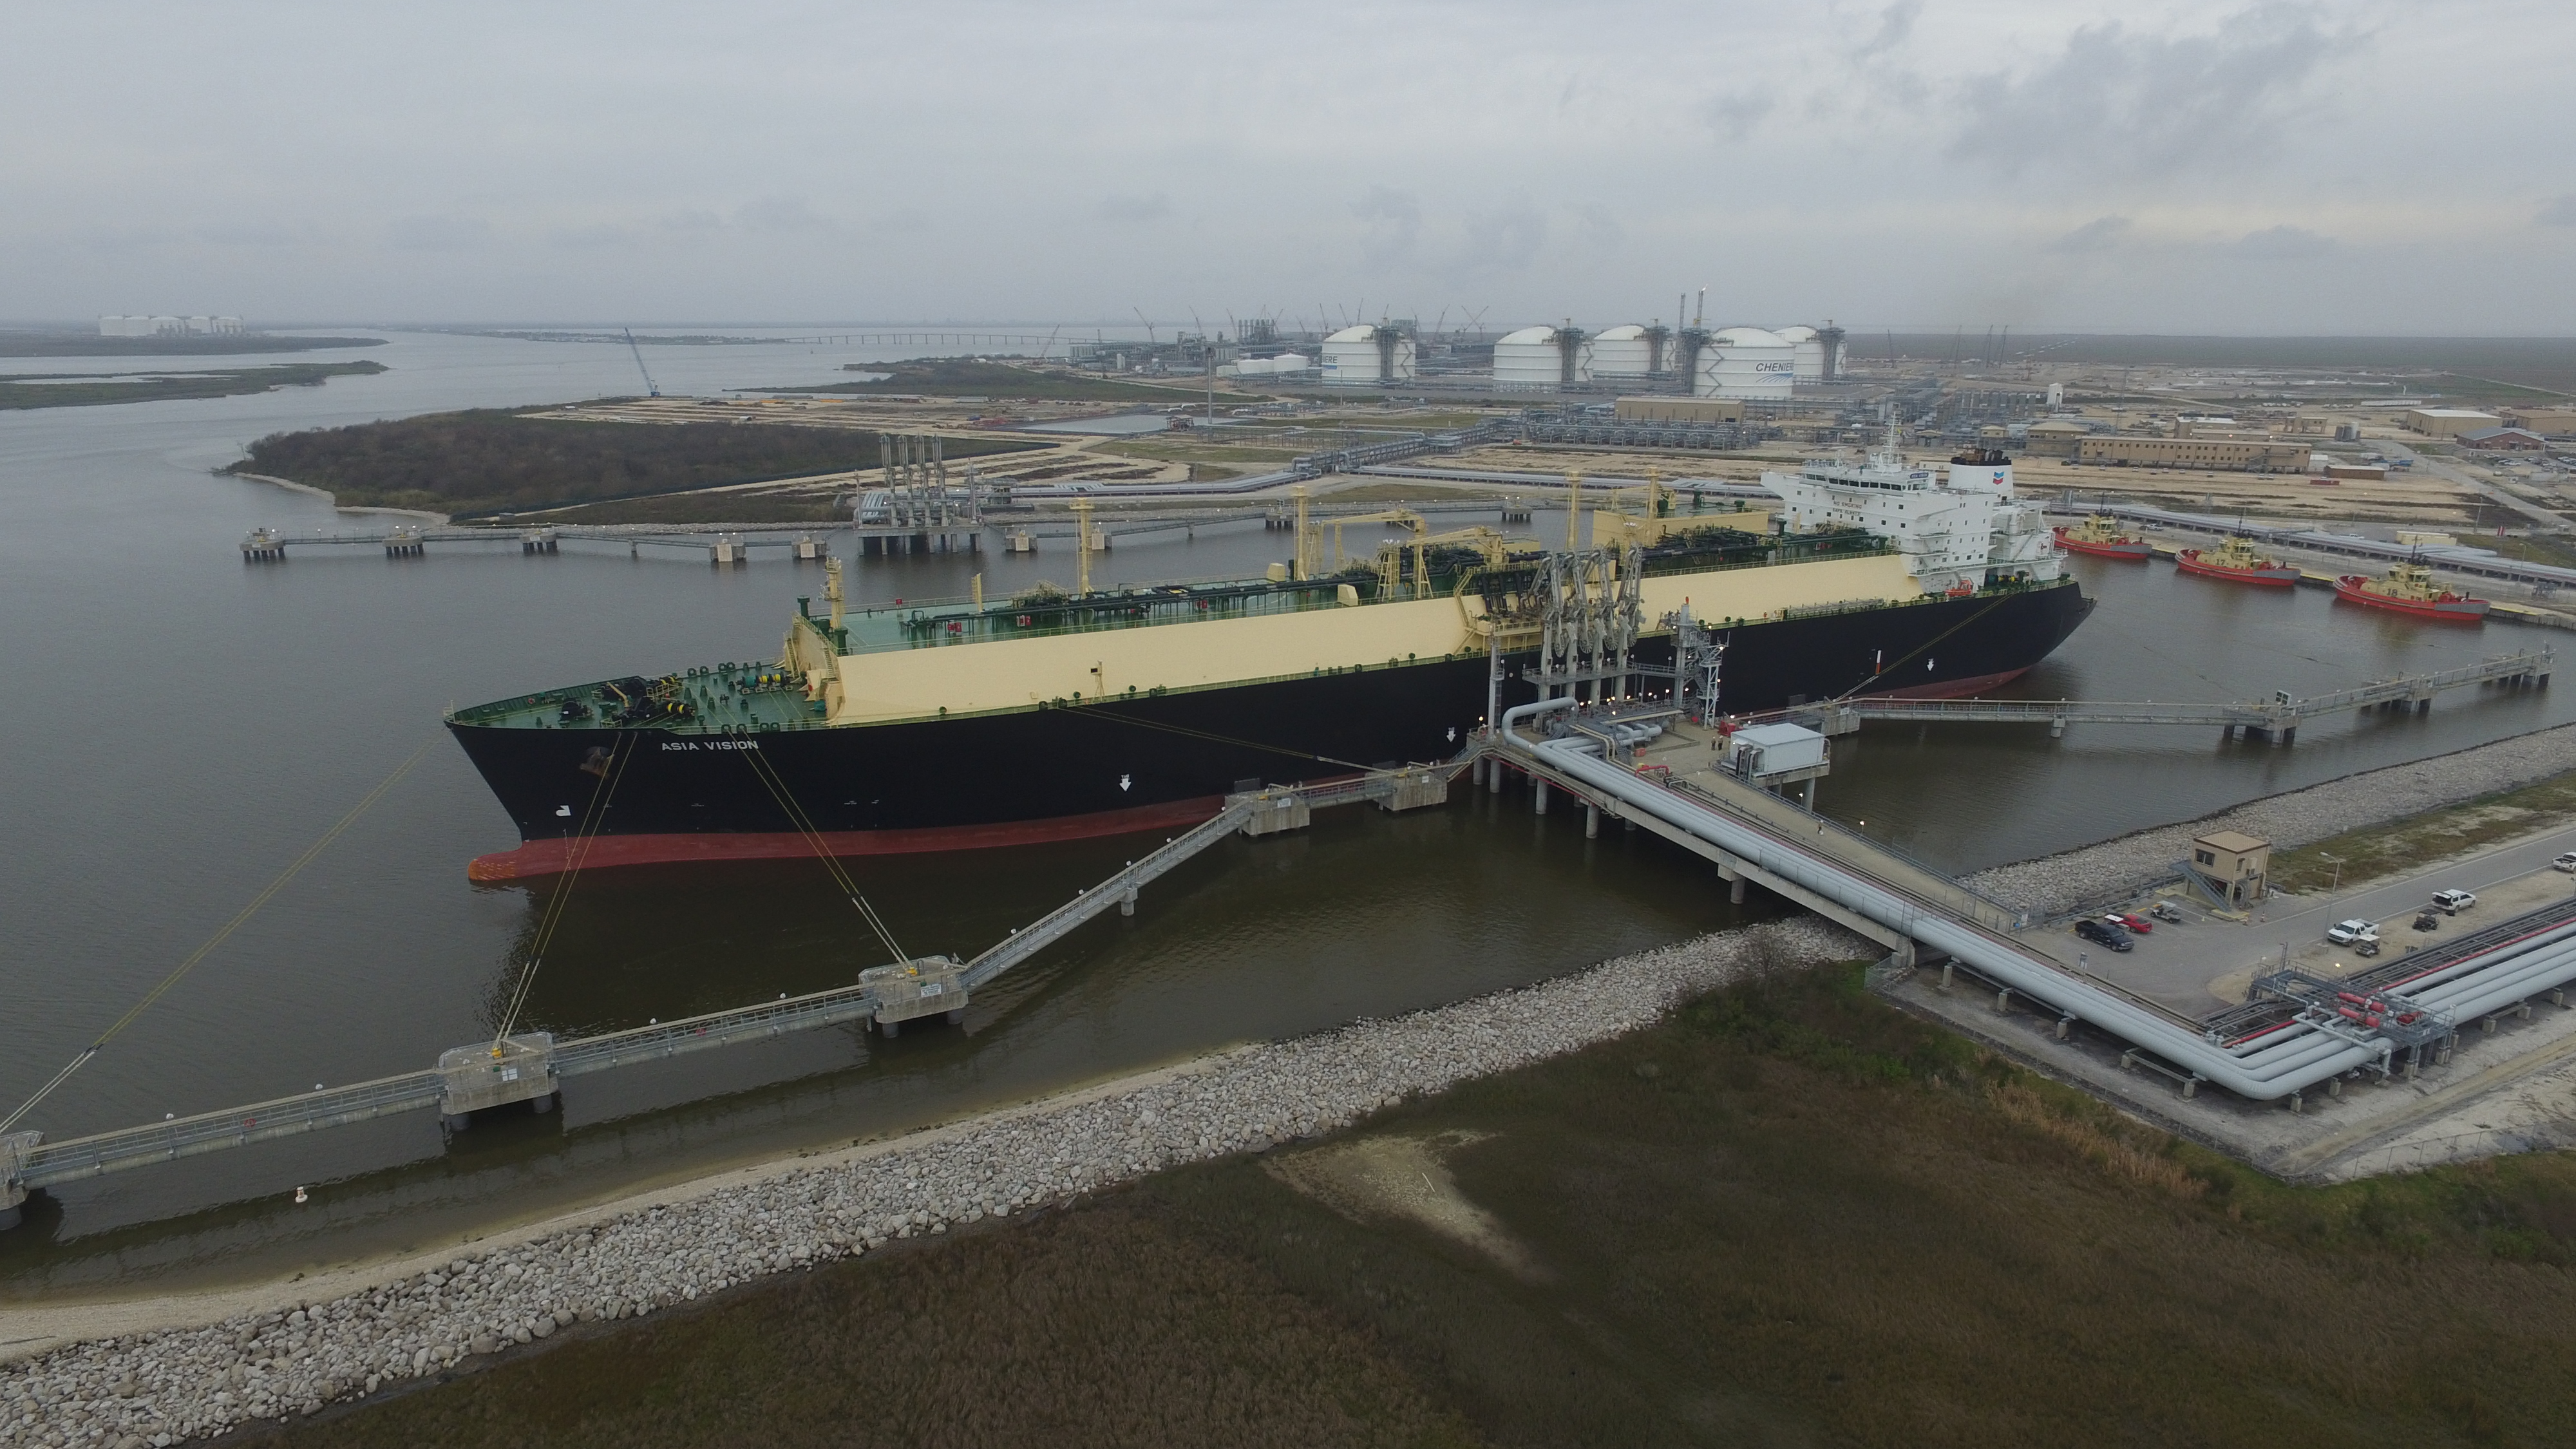
The east coast LNG blame game is on again fuelled by the latest ACCC Gas Inquiry report, EnergyQuest has observed in its monthly report for July.
“We have had a close look at the ACCC’s numbers to try to find their 24 Gladstone spot cargoes in six months. The ACCC appears to be mixing up a modest number of spot cargoes from producers (covered by the Heads of Agreement with the government) with a larger number of contracted cargoes on-sold by buyers into spot markets. It would be an absurd situation, and one incredibly damaging to Australia’s reputation, if the Australian government purported to control whether LNG buyers are allowed to on-sell LNG that they have contracted and for which they have paid. Gladstone supplied a staggering 20% of China’s LNG imports in 2021-22, the report says.
EnergyQuest said that after a close look at the numbers it perceived that a gas shortfall was possible in 2023 but believed it would be possible to alleviate this through collaboration between the producers and government without heavy-handed government intervention that is likely to make the situation worse.
The report noted that record highs in east coast spot gas prices had been driven by coal-fired generation hitting a new low.
“To state the bleeding obvious, unless the decline of coal is matched by growth of renewables with firming capacity, it is inevitable that there will be high gas prices, particularly in winter,” the report commented.
Other highlights of the report are:
- In July Australian projects shipped 6.20 million tonnes (90 cargoes), down on the record 7.31 Mt (106 cargoes) in June.
- EnergyQuest estimates that Australian LNG export revenue increased in July to a record $6.84 billion, up from $6.69 billion in June.
- Compared with June, Australian projects delivered three fewer cargoes to China, Korea and Japan in July. There were no cargoes delivered to Europe.
- West Coast shipments decreased to 4.5 Mt in July (a record 5.5 Mt in June), with 64 cargoes in July compared to 79 in June.
- East coast LNG shipments decreased to 1.7 Mt in July (1.8 Mt in June), with 26 cargoes compared to 27 in June, and 27 cargoes of 1.8 Mt a year ago.
- There were five spot cargoes reported for shipping from Australian projects in July, all from the west coast (6% of total shipments).
- Queensland exported gas to the other states in July, with net flows in a westerly direction. Westerly flows were seen for the entire month. Net gas flows from Queensland to other states were 6.2 PJ in July.
- CSG production from fields operated by the LNG producers was 112.1 PJ in July, higher than 107.6 PJ in June and 9.6 PJ above exports including fuel gas.
- Queensland short-term domestic gas prices in July were higher averaging $40.85/GJ ($36.85/GJ in June) at Wallumbilla and $40.20/GJ ($37.93/GJ) in Brisbane. Southern short-term domestic gas prices in July were higher compared to those in June averaging $42.89/GJ ($39.44/GJ) in Adelaide and $43.33/GJ ($40.70/GJ) in Sydney, and lower in Victoria compared to those in June averaging $37.30/GJ ($38.82/GJ).
- East coast electricity demand increased by 2% in July compared with a year earlier. Power generation in July from coal fell to a record low for this time of year, with generation down by 645 GWh from a year earlier, but up on June. Gas generation was up by 464 GWh from a year earlier. Gas-use for power generation was up by 4.55 PJ in July (37%) compared with a year earlier.
- Compared with July last year, total heating and cooling days were higher in July in all cities except Sydney.

