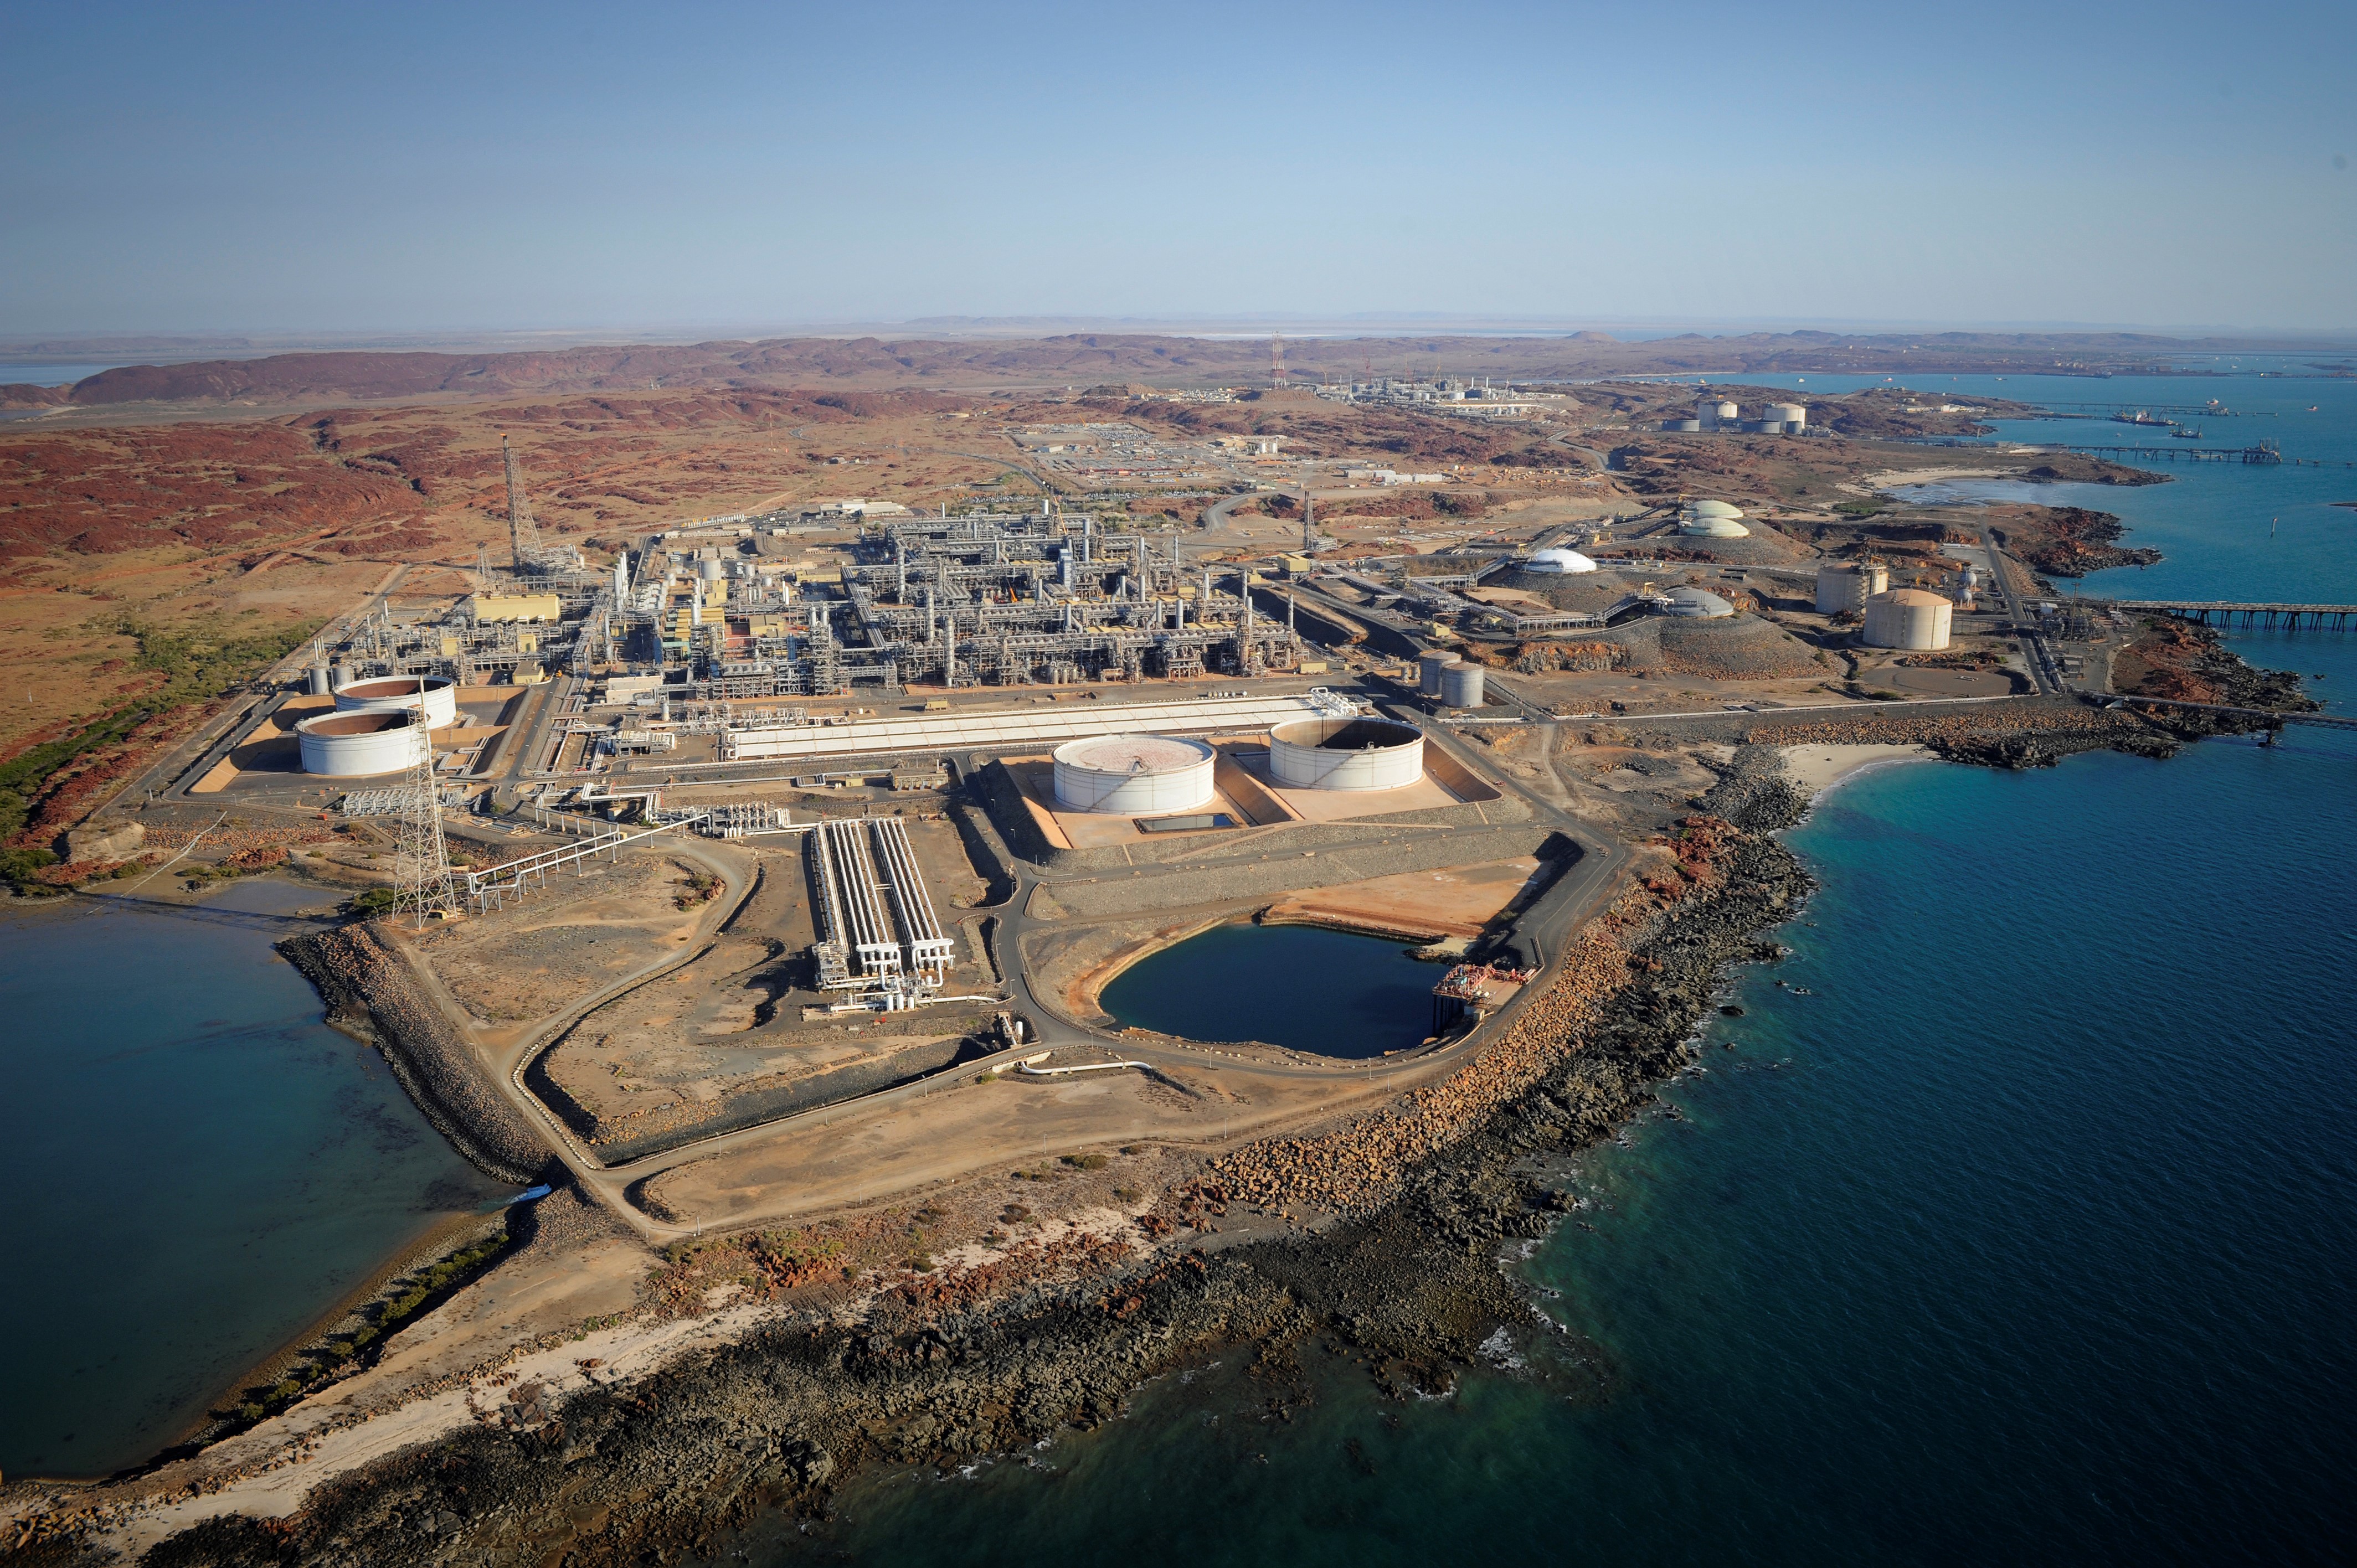
Australia hit a record in petroleum production in 2018-19 to a peak of 1,010 million barrels of oil equivalent in a milestone moment according to data compiled by energy consulstancy, EnergyQuest.
This was primarily driven by record gas production, which was up 16% to 5,082 PJ as LNG export revenue soared 61% to %50 billion with production also up 22% to a record 75 million tonnes.
From east to west production records were recorded with east coast gas output up 2% to 1,865PJ and coal seam gas also summiting, up 5% to 1,461PJ.
However, in spite of these peaks, east coast domestic gas production was down 6% to 563 PJ, the lowest since 2009-10, contrasting with a record WA domestic gas production which was up 2% to 401PJ.
Production of crude oil and natural gas liquids (condensate and LPG) was up 47% to 81 MMboe, the highest since 2014-15.
In the second quarter, national LNG production soared to 19.3Mt, up 24% and an annualised rate of 77.2MT.
EnergyQuest said another significant rise was expected in the third quarter as since the end of June, Ichthys hit almost 100% capacity and Prelude began shipping about one cargo a week.
On a quarter-on-quarter (qoq) basis, revenue was up 25% at $11.3 billion. However, the celebration hit a sobering note as seven consecutive increases in export prices came to an end as the average LNG cargo dropped from A$13.42/GJ in Q1 2019 to A$10.64 in Q2.
East coast gas production increased by 6%, up 26.0 PJ to 479.3 PJ, largely due to higher CSG production, which increased by 7.4% or 25.3 PJ qoq to a record 366.2 PJ. Nevertheless, east coast domestic gas production fell by 6% qoq to 149 PJ.
Domestic gas consumption on the east coast was 4.3 PJ lower qoq in Q2 and was at its lowest Q2 levels for at least 10 years.
Queensland exported gas to the southern states in Q2, in line with seasonal patterns but at a higher rate than in previous years.
In Q2 the average rate of westward flow was 160 TJ/d and this increased in July to an average of 262 TJ/d.
Western Australia domestic gas production in Q2 was 106 PJ up 8.8% qoq. This is a quarterly record and in excess of 97 PJ of consumption, with the surplus flowing into storage. Unlike on the east coast, WA is experiencing a surfeit of domestic gas.
And there is still more gas to come with Waitsia (820 PJ), Dorado (636 PJ) and Strike Energy’s recent West Erregulla discovery with a pre-drill prospective resource estimate of 966 PJ all queueing up to add to the energy basket.
Average Q2 spot electricity prices remained high in Victoria ($97.38/MWh), South Australia ($91.47/MWh and Tasmania ($98.02/MWh). As with gas, Queensland remained the lowest priced east coast state for electricity ($75.48/MWh).
EnergyQuest corrected one myth: “It is not correct that Australian consumers pay more for gas than Australia’s gas customers in Japan. In June 2019 the average landed price of Japanese LNG imports from Australia was US$9.00/GJ or A$13.00/GJ, prior to the costs of regasification, transport and profit margins in Japan. The general notion that Australian industry pays more for gas than offshore customers for Australian LNG has also recently been debunked in the ACCC’s Gas Inquiry 2017-2020 Interim report for July 2019 (page 63 of the ACCC report).”
The report said Australian LNG exports comprised 23% of the global market from January to August, compared to the US at 10%.
South Australia had the highest concentration of renewables (wind and solar) in Q2 (48%), followed by Victoria (15%) and Tasmania (12%). NEM generation in Q2 was flat. Coal declined by 4%, gas was flat and renewables grew by 41%.
According to AEMO, gas demand in the Victorian declared wholesale gas market for Friday 9 August 2019 was the highest ever recorded, with a total of approximately 1,304 TJ surpassing the previous 12-year record
In the first half of 2019, the volume of gas heading into the east coast domestic market from the LNG projects more than halved, down from 55.0 PJ in the first half of 2018 to 26.3 PJ in the first half of 2019, partly offset by higher production from other CSG fields plus gas through the Northern Gas Pipeline but the total Queensland surplus has still declined from 84.5 PJ in the first half of 2018 to 66.2 PJ in the first half of 2019.
In terms of demand and supply, the east coast gas market balance deteriorated slightly in Q2 2019 compared with an improved position in Q1 2019.
Drilling of CSG development wells by LNG operators in Q2 recovered from its down-turn in Q1, with 209 wells compared with 146 in Q1. This is the highest quarterly drilling rate since Q3 2014.


